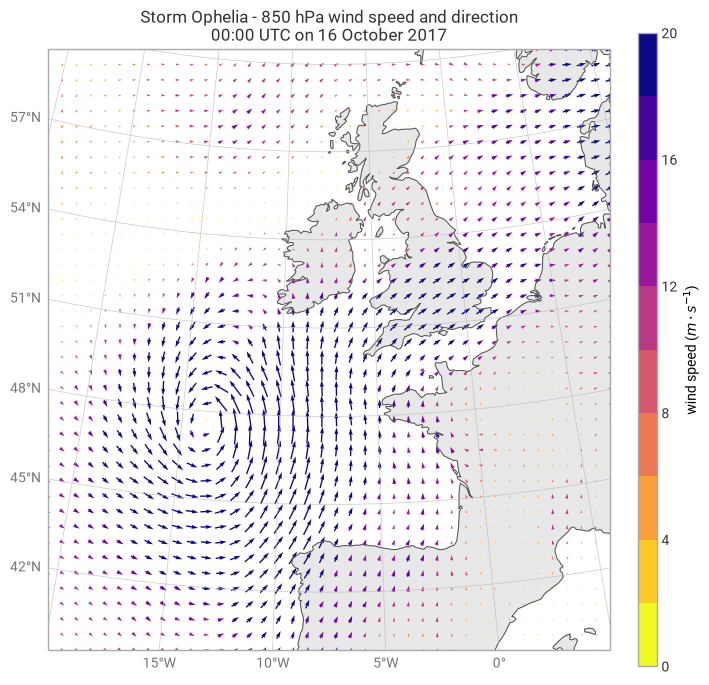
Quiver with colours
[1]:
import earthkit.data as ekd
import earthkit.plots as ekp

data = ekd.from_source("sample", "storm_ophelia_wind_850.grib")

chart = ekp.Map(domain=[-20, 5, 40, 60])

style = ekp.styles.Style(
    colors="plasma_r",
    levels=range(0, 22, 2),
    units="m s-1",
)

chart.quiver(data, style=style)
chart.legend(label="wind speed ({units})", location="right")

chart.land()
chart.coastlines()
chart.gridlines()

chart.title("Storm Ophelia - {level} hPa wind speed and direction\n{time:%H:%M UTC on %-d %B %Y}")

chart.show()