Satellite level-2 data
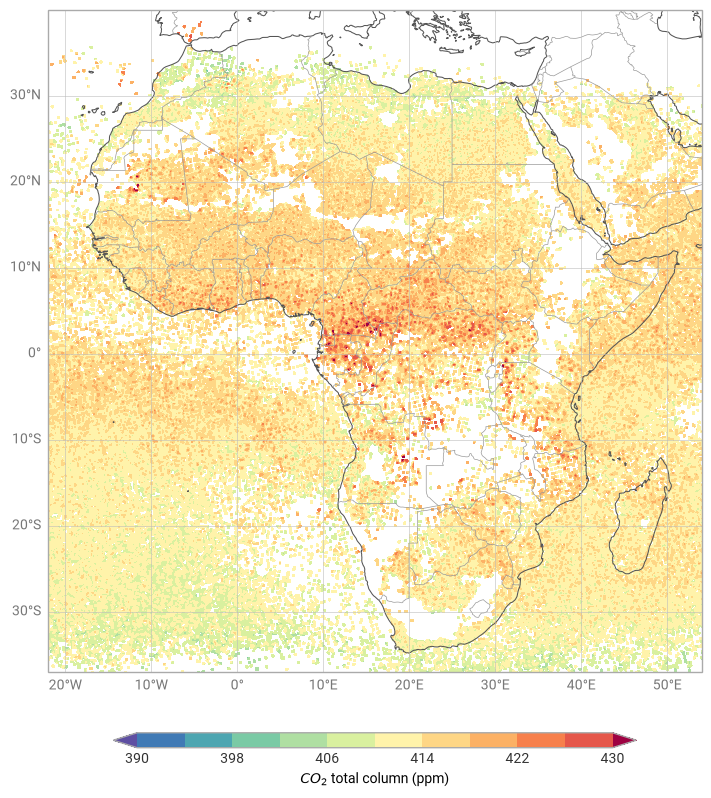
This example demonstrates how to plot unstructured satellite data with contourf as though it were a gridded field.
[1]:
import earthkit.data as ekd
import earthkit.plots as ekp

from earthkit.plots.resample import Unstructured
[2]:
LEVELS = [i for i in range(390, 431, 4)]
STYLE = ekp.styles.Style(
    levels=LEVELS,
    extend="both",
    colors="Spectral_r",
)

ds = ekd.from_source(
    "url",
    "https://sites.ecmwf.int/repository/earthkit-data/test-data/CO2_iasi_metop_c_nlis_2021_01.nc",
).to_xarray()
[3]:
chart = ekp.Map(domain="Africa")

chart.contourf(
    z=ds.co2.values,
    x=ds.longitude.values,
    y=ds.latitude.values,
    style=STYLE,
    resample=Unstructured(distance_threshold="auto"),
)

chart.coastlines()
chart.borders()
chart.gridlines()

chart.legend(label="$CO_2$ total column (ppm)")

chart.show()