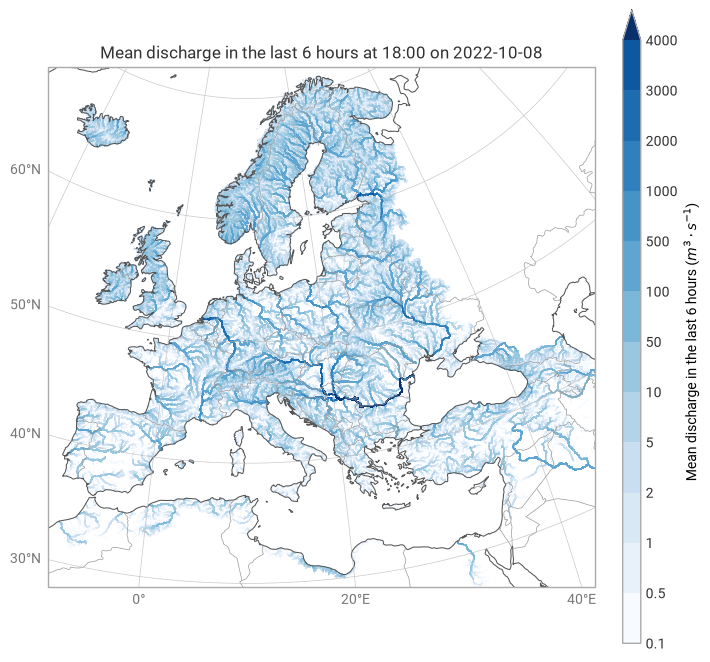
Lambert Azimuthal Equal Area
This example demonstrates how earthkit-plots is able to detect grid and projection metadata from CF-compliant netCDF, and use that to automatically plot data on its native projection. In this case, we are plotting data from the European Flood Awareness System (EFAS) which is defined on a Lambert Azimuthal Equal Area projection.
[1]:
import earthkit.data as ekd
import earthkit.plots as ekp

data = ekd.from_source("sample", "efas.nc").to_fieldlist()

style = ekp.styles.Style(
    colors="Blues",
    levels=[0.1, 0.5, 1, 2, 5, 10, 50, 100, 500, 1000, 2000, 3000, 4000],
    extend="max",
    units="m3 s-1",
)

chart = ekp.Map()

chart.plot(data[0], style=style)

chart.title()
chart.legend(location="right")

chart.coastlines()
chart.borders()
chart.gridlines()

chart.show()