Working with shapefiles
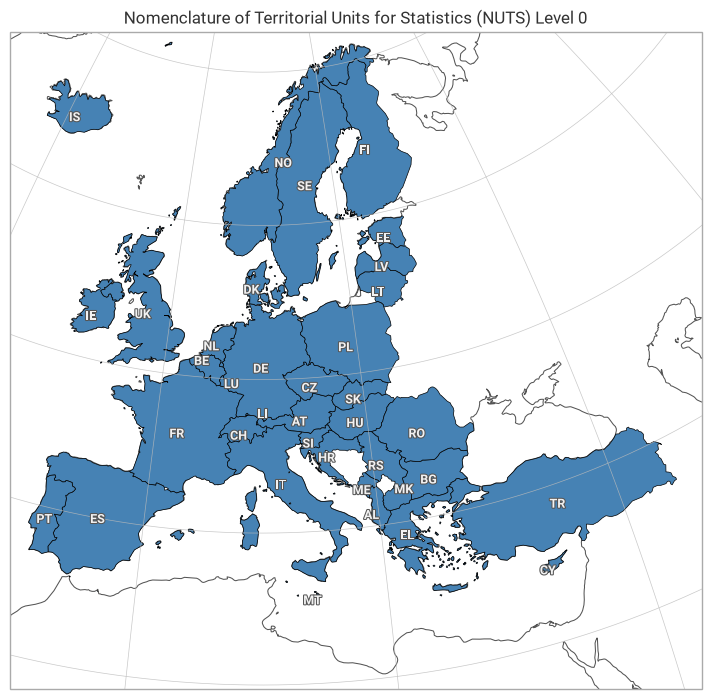
This example demonstrates how to plot a shapefile directly from a file onto a map.
[1]:
!wget https://gisco-services.ec.europa.eu/distribution/v2/nuts/shp/NUTS_RG_20M_2021_4326_LEVL_0.shp.zip
--2026-06-23 15:15:33--  https://gisco-services.ec.europa.eu/distribution/v2/nuts/shp/NUTS_RG_20M_2021_4326_LEVL_0.shp.zip
Resolving gisco-services.ec.europa.eu (gisco-services.ec.europa.eu)... 13.69.248.157
Connecting to gisco-services.ec.europa.eu (gisco-services.ec.europa.eu)|13.69.248.157|:443... connected.
HTTP request sent, awaiting response... 200 OK
Length: 95189 (93K) [application/zip]
Saving to: ‘NUTS_RG_20M_2021_4326_LEVL_0.shp.zip.2’

NUTS_RG_20M_2021_43 100%[===================>]  92.96K  --.-KB/s    in 0.01s

2026-06-23 15:15:33 (7.69 MB/s) - ‘NUTS_RG_20M_2021_4326_LEVL_0.shp.zip.2’ saved [95189/95189]
[2]:
import earthkit.plots

chart = earthkit.plots.Map(domain="Europe")

chart.coastlines()

chart.shapes(
    "NUTS_RG_20M_2021_4326_LEVL_0.shp.zip",
    labels="NUTS_ID",  # Label taken directly from shapefile metadata
    adjust_labels=True,
)

chart.gridlines(draw_labels=False)

chart.title("Nomenclature of Territorial Units for Statistics (NUTS) Level 0")

chart.show()