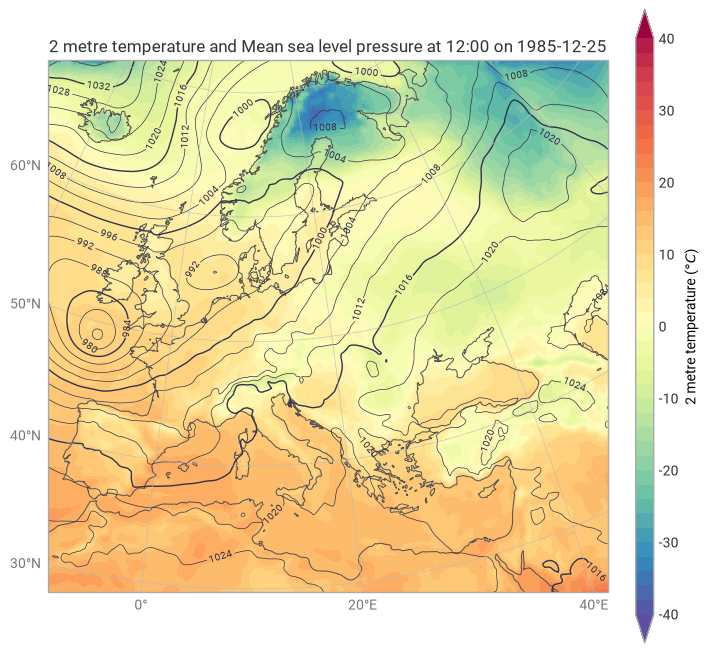
Temperature and pressure
This example demonstrates a basic temperature and pressure plot, with a few features of Earthkit to note:
You can directly unpack a
FieldListinto multiple variables. This is especially useful if, as in the example below, you know how many fields you have already and what is in each (in this case we happen to know that this GRIB file contains temperature and pressure, in that order).Using the convient
plotmethod will look for an automatic style for the given data based on its metadata, and
[1]:
import earthkit.data as ekd
import earthkit.plots as ekp

temperature, pressure = ekd.from_source("sample", "era5-2t-msl-1985122512.grib").to_fieldlist()

chart = ekp.Map(domain="Europe")

chart.plot(temperature, units="celsius")
chart.plot(pressure, units="hPa")

chart.legend(location="right")

chart.coastlines()

chart.title()
chart.gridlines()

chart.show()