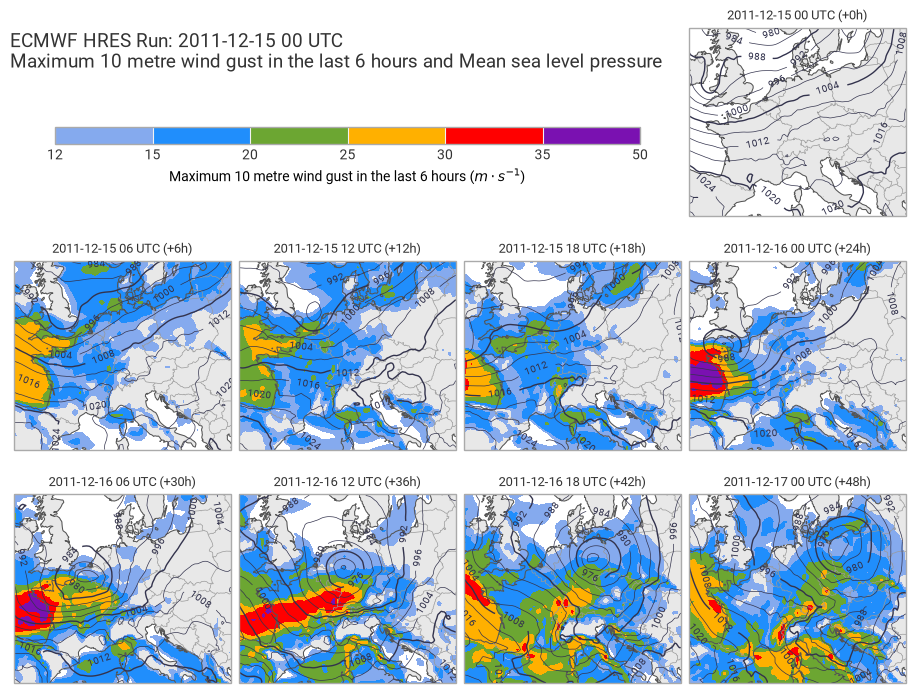
Weather forecast steps
This example demonstrates how to build a multi-subplot figure using a custom layout with matplotlib.
[1]:
import earthkit.data as ekd
import earthkit.plots as ekp

import matplotlib.pyplot as plt

data = ekd.from_source(
    "url",
    "https://get.ecmwf.int/repository/test-data/metview/gallery/fc_msl_wg_joachim.grib",
).to_fieldlist()
data.ls()
[1]:
| parameter.variable | time.valid_datetime | time.base_datetime | time.step | vertical.level | vertical.level_type | ensemble.member | geography.grid_type | |
|---|---|---|---|---|---|---|---|---|
| 0 | msl | 2011-12-15 00:00:00 | 2011-12-15 | 0 days 00:00:00 | 0 | surface | 0 | regular_ll |
| 1 | 10fg6 | 2011-12-15 00:00:00 | 2011-12-15 | 0 days 00:00:00 | 0 | surface | 0 | regular_ll |
| 2 | msl | 2011-12-15 06:00:00 | 2011-12-15 | 0 days 06:00:00 | 0 | surface | 0 | regular_ll |
| 3 | 10fg6 | 2011-12-15 06:00:00 | 2011-12-15 | 0 days 06:00:00 | 0 | surface | 0 | regular_ll |
| 4 | msl | 2011-12-15 12:00:00 | 2011-12-15 | 0 days 12:00:00 | 0 | surface | 0 | regular_ll |
| 5 | 10fg6 | 2011-12-15 12:00:00 | 2011-12-15 | 0 days 12:00:00 | 0 | surface | 0 | regular_ll |
| 6 | msl | 2011-12-15 18:00:00 | 2011-12-15 | 0 days 18:00:00 | 0 | surface | 0 | regular_ll |
| 7 | 10fg6 | 2011-12-15 18:00:00 | 2011-12-15 | 0 days 18:00:00 | 0 | surface | 0 | regular_ll |
| 8 | msl | 2011-12-16 00:00:00 | 2011-12-15 | 1 days 00:00:00 | 0 | surface | 0 | regular_ll |
| 9 | 10fg6 | 2011-12-16 00:00:00 | 2011-12-15 | 1 days 00:00:00 | 0 | surface | 0 | regular_ll |
| 10 | msl | 2011-12-16 06:00:00 | 2011-12-15 | 1 days 06:00:00 | 0 | surface | 0 | regular_ll |
| 11 | 10fg6 | 2011-12-16 06:00:00 | 2011-12-15 | 1 days 06:00:00 | 0 | surface | 0 | regular_ll |
| 12 | msl | 2011-12-16 12:00:00 | 2011-12-15 | 1 days 12:00:00 | 0 | surface | 0 | regular_ll |
| 13 | 10fg6 | 2011-12-16 12:00:00 | 2011-12-15 | 1 days 12:00:00 | 0 | surface | 0 | regular_ll |
| 14 | msl | 2011-12-16 18:00:00 | 2011-12-15 | 1 days 18:00:00 | 0 | surface | 0 | regular_ll |
| 15 | 10fg6 | 2011-12-16 18:00:00 | 2011-12-15 | 1 days 18:00:00 | 0 | surface | 0 | regular_ll |
| 16 | msl | 2011-12-17 00:00:00 | 2011-12-15 | 2 days 00:00:00 | 0 | surface | 0 | regular_ll |
| 17 | 10fg6 | 2011-12-17 00:00:00 | 2011-12-15 | 2 days 00:00:00 | 0 | surface | 0 | regular_ll |
[2]:
gust = data.sel({"parameter.variable": "10fg6"})
msl = data.sel({"parameter.variable": "msl"})
[3]:
figure = ekp.Figure(domain=[-5, 23, 40, 58], figsize=(9, 7), rows=3, columns=4)

gust_style = ekp.styles.Style(
    colors=["#85AAEE", "#208EFC", "#6CA632", "#FFB000", "#FF0000", "#7A11B1"],
    levels=[12, 15, 20, 25, 30, 35, 50],
    units="m s-1",
)

figure.add_map(0, 3)
for i in range(8):
    figure.add_map(1 + i // 4, i % 4)

figure.contourf(gust, style=gust_style)
figure.plot(msl, units="hPa")

figure.land()
figure.coastlines()
figure.borders()

ax = plt.axes((0.05, 0.8, 0.65, 0.025))
figure.legend(ax=ax)

figure.subplot_titles("{time:%Y-%m-%d %H} UTC (+{lead_time}h)")
figure.title(
    "ECMWF HRES Run: {base_time:%Y-%m-%d %H} UTC\n{variable_name}",
    fontsize=14,
    horizontalalignment="left",
    x=0,
    y=0.96,
)

figure.show()