El Niño
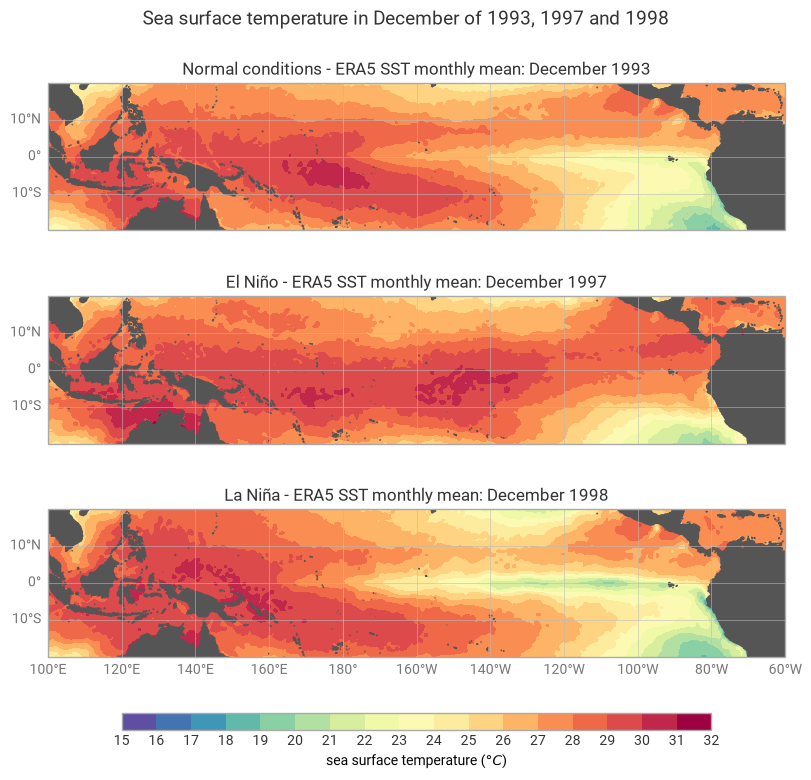
This example demonstrates accessing data from the C3S Climate Data Store (CDS) and plotting it as a series of subplots.
[1]:
import earthkit.data as ekd
import earthkit.plots as ekp

YEARS = {
    1993: "Normal conditions",
    1997: "El Niño",
    1998: "La Niña",
}

DOMAIN = [100, 300, -20, 20]

# data = ekd.from_source(
#     "cds",
#     "reanalysis-era5-single-levels-monthly-means",
#     {
#         "product_type": "monthly_averaged_reanalysis",
#         "variable": "sea_surface_temperature",
#         "year": list(YEARS),
#         "month": "12",
#         "time": "00:00",
#         "area": [20, 100, -20, -60],
#         "grid": [0.25, 0.25],
#     },
# ).to_fieldlist()

data = ekd.from_source("sample", "era5-el-nino.grib").to_fieldlist()

style = ekp.styles.Style(
    colors="Spectral_r",
    levels=range(15, 33),
    units="celsius",
    ticks=range(15, 33),
)

figure = ekp.Figure(rows=3, columns=1, figsize=(8, 7.5))

for i, year in enumerate(YEARS):
    subplot = figure.add_map(domain=DOMAIN)
    subplot.contourf(data[i], style=style)
    subplot.title(f"{YEARS[year]} - ERA5 {{short_name!u}} monthly mean: {{time:%B %Y}}")

figure.land(color="#555", zorder=2)
figure.gridlines(xstep=20, ystep=10, sharex=True)

figure.title("{variable_name} in {time:%B} of {time:%Y}", fontsize=14)

figure.legend(label="{variable_name!l} ({units})")

figure.show()