Grid points
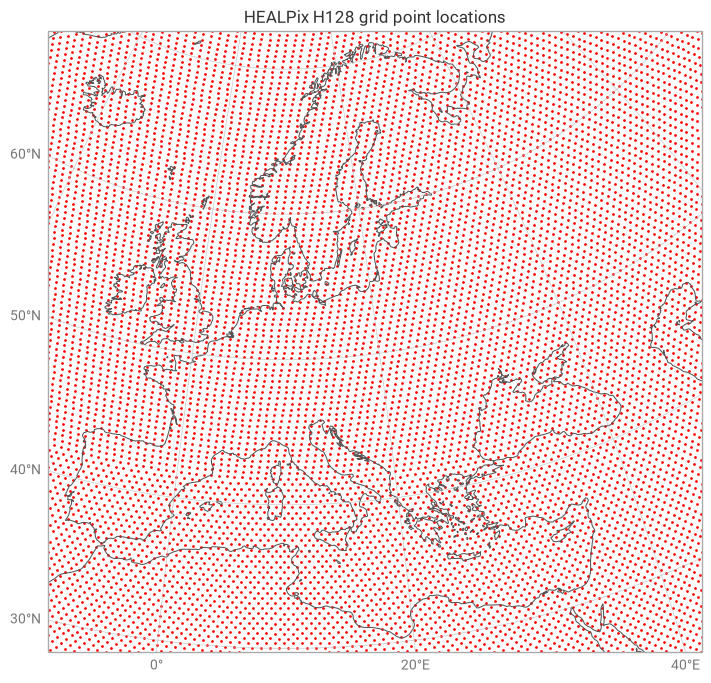
grid_points plots the centroid location of every grid cell as a uniform dot on the map. Unlike point_cloud, it does not colour the points by data value — all dots are drawn in the same colour. This makes it a diagnostic tool rather than a data visualisation:
inspect the density and distribution of a grid before plotting data on it,
verify that the correct grid is being used (especially when metadata may be missing or overridden),
overlay grid point positions on top of a coloured field for context.
Because grid_points ignores style, levels and units arguments, it is much faster than point_cloud for large grids.
Example: inspecting a HEALPix grid
We load a HEALPix GRIB file and plot only the centroid locations, with no data values shown.
[1]:
import earthkit.data as ekd

import earthkit.plots as ekp

data = ekd.from_source("sample", "healpix-h128-nested-2t.grib")

chart = ekp.Map(domain="Europe")

chart.grid_points(data)

chart.coastlines()
chart.gridlines()
chart.title("HEALPix H128 grid point locations")

chart.show()
Customising the markers
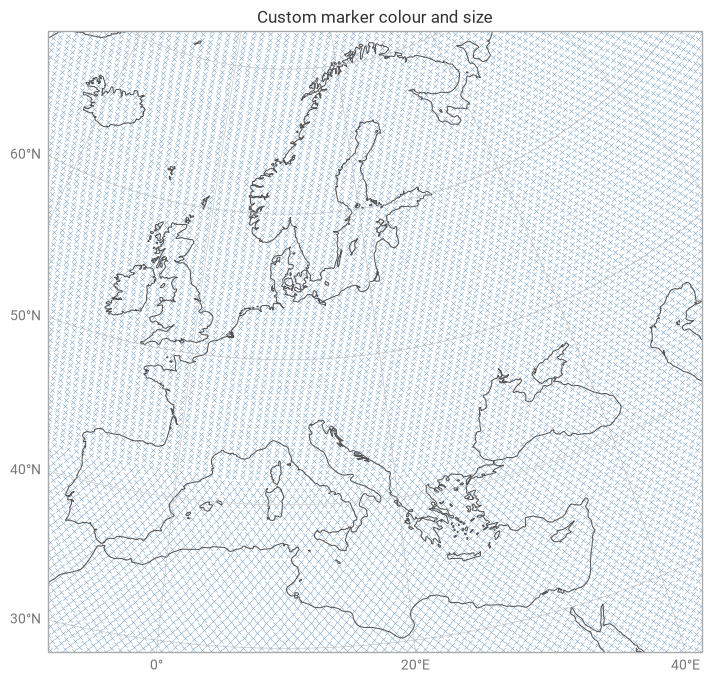
Any matplotlib scatter keyword argument can be passed to control the appearance of the points: color, s (size), marker, alpha, etc.
[2]:
chart = ekp.Map(domain="Europe")

chart.grid_points(data, c="steelblue", marker="x", s=10, alpha=0.6)

chart.coastlines()
chart.gridlines()
chart.title("Custom marker colour and size")

chart.show()
Comparing two grids side by side
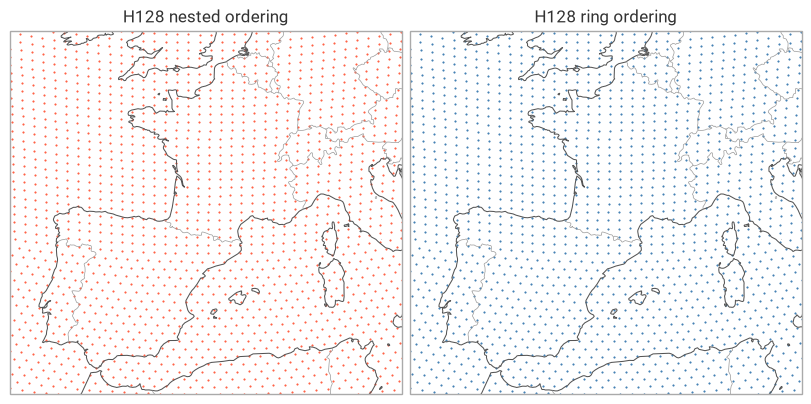
A common use case is comparing the grid structure of two different datasets — for example, a nested-ordering HEALPix grid vs. a ring-ordering one of the same resolution.
[3]:
nested = ekd.from_source("sample", "healpix-h128-nested-2t.grib")
ring = ekd.from_source("sample", "healpix-h128-ring-2t.grib")

figure = ekp.Figure(rows=1, columns=2, domain=["France", "Spain"])

ax = figure.add_map()
ax.grid_points(nested, s=4, c="tomato")
ax.title("H128 nested ordering")

ax = figure.add_map()
ax.grid_points(ring, s=4, c="steelblue")
ax.title("H128 ring ordering")

figure.coastlines()
figure.borders()

figure.show()
NOTE: grid_points silently ignores style, levels, units and colors arguments — it always draws uniform markers. To colour points by data value, use point_cloud instead.