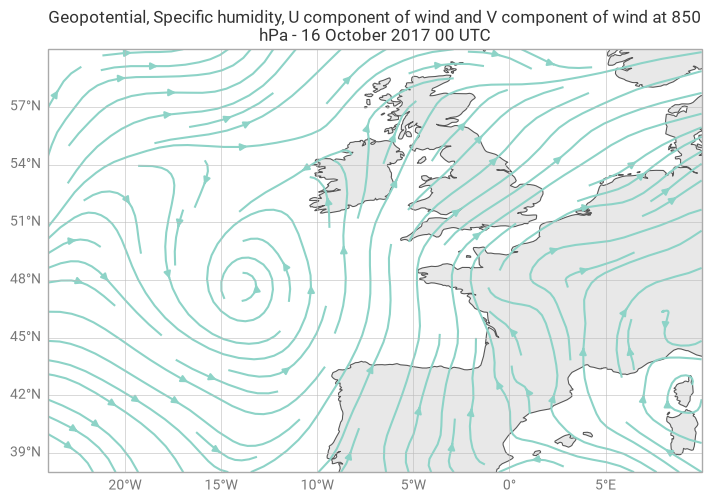
Streamlines from wind U and V components
[1]:
import earthkit.data as ekd
import earthkit.plots as ekp

data = ekd.from_source(
    "url",
    "https://get.ecmwf.int/repository/test-data/metview/gallery/advection_850.grib",
)

chart = ekp.Map(domain=[-24, 10, 38, 60], crs="PlateCarree")

chart.streamplot(data)

chart.land()
chart.coastlines()
chart.gridlines()

chart.title("{variable_name} at {level} hPa - {time:%-d %B %Y %H UTC}")

chart.show()