HEALPix interpolated
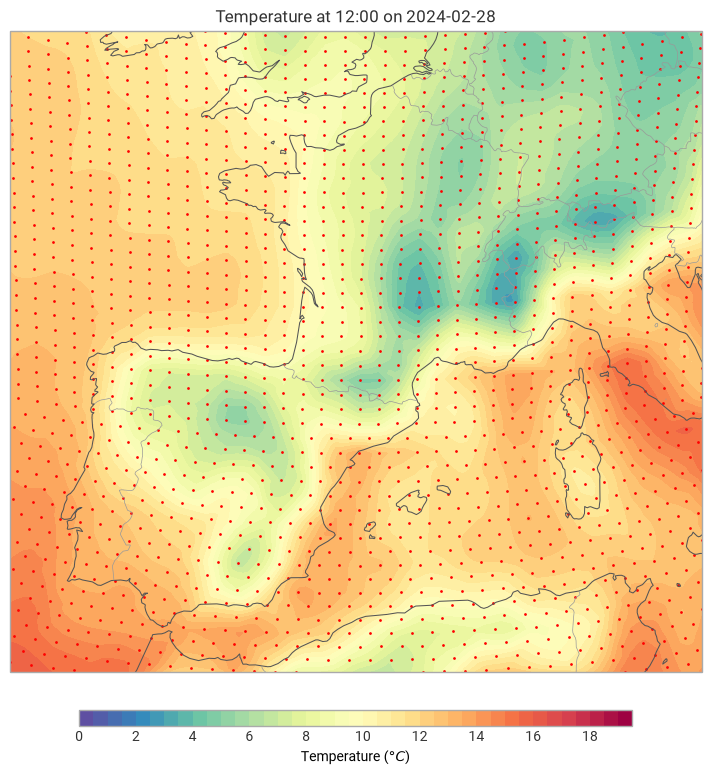
This example demonstrates how plotting HEALPix data with contourf will automatically interpolate the grid points into smooth contours.
[1]:
import earthkit.data as ekd
import earthkit.plots as ekp

import numpy as np

data = ekd.from_source("sample", "healpix-h128-nested-2t.grib")

chart = ekp.Map(domain=["France", "Spain"])

chart.contourf(
    data,
    levels=np.arange(0, 20, 0.5),
    colors="Spectral_r",
    units="celsius",
)

chart.grid_points(data)

chart.title()
chart.legend()

chart.coastlines()
chart.borders()

chart.show()