Ocathedral point cloud
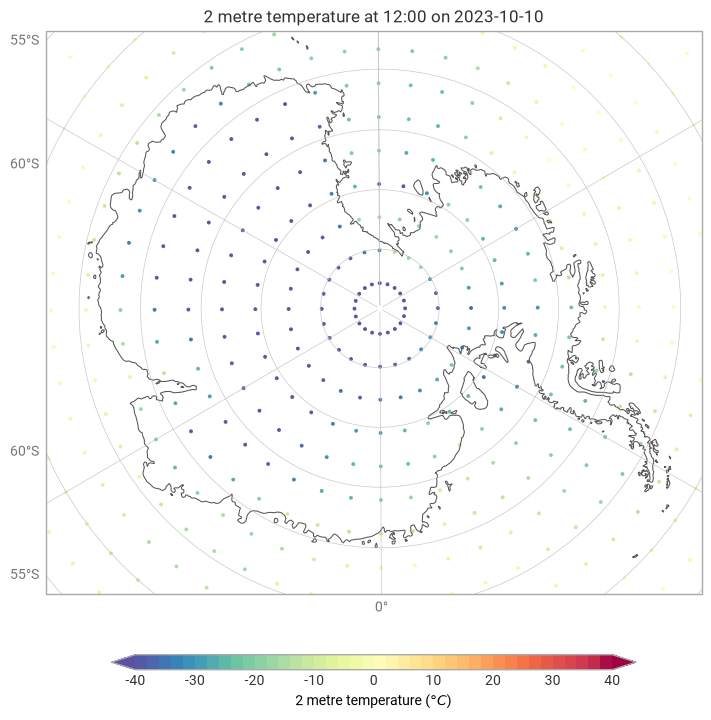
This example demonstrates how plotting octahedral data with scatter will plot the centroid of each grid cell as a point.
[1]:
import earthkit.data as ekd
import earthkit.plots as ekp

data = ekd.from_source(
    "url",
    "https://get.ecmwf.int/repository/test-data/earthkit-regrid/test-data/global_0_360/O32.grib",
)

chart = ekp.Map(domain="Antarctica")

chart.point_cloud(data, units="celsius", auto_style=True)

chart.title()
chart.legend()

chart.coastlines()
chart.gridlines()

chart.show()