RGB composite
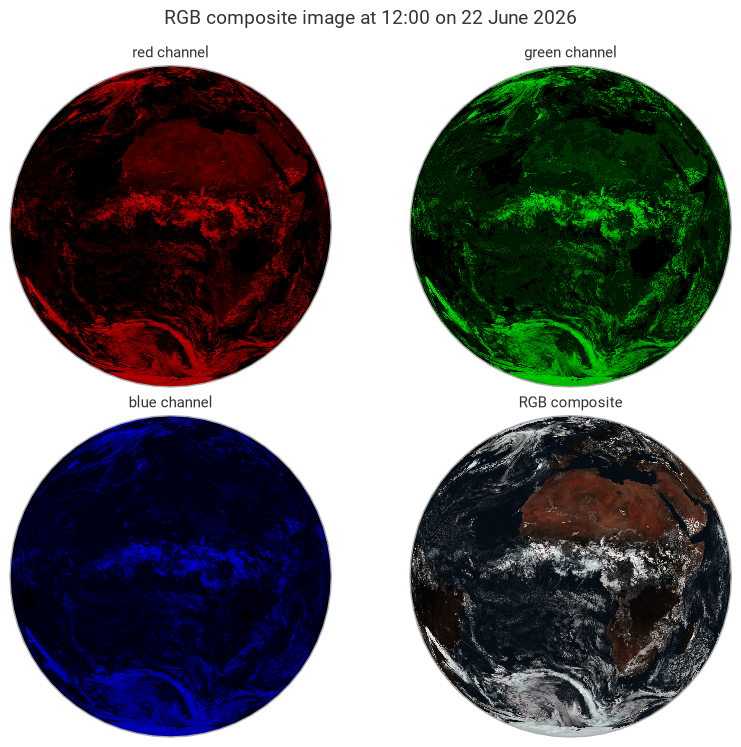
This example demonstrates how to plot an RGB composite image from red, green and blue streams.
[1]:
import earthkit.data as ekd

data = ekd.from_source("sample", "rgb-sample.grib").to_fieldlist()

data.ls()
[1]:
| parameter.variable | time.valid_datetime | time.base_datetime | time.step | vertical.level | vertical.level_type | ensemble.member | geography.grid_type | |
|---|---|---|---|---|---|---|---|---|
| 0 | cdrfl | 2026-06-22 12:00:00 | 2026-06-22 | 0 days 12:00:00 | None | unknown | None | regular_ll |
| 1 | cdrfl | 2026-06-22 12:00:00 | 2026-06-22 | 0 days 12:00:00 | None | unknown | None | regular_ll |
| 2 | cdrfl | 2026-06-22 12:00:00 | 2026-06-22 | 0 days 12:00:00 | None | unknown | None | regular_ll |
[2]:
import earthkit.plots as ekp
import cartopy.crs as ccrs

COLORS = {
    "red": (1, 0, 0),
    "green": (0, 1, 0),
    "blue": (0, 0, 1),
}

figure = ekp.Figure(crs=ccrs.NearsidePerspective(), rows=2, columns=2)

for i, color in enumerate(COLORS):
    channel_plot = figure.add_map()
    channel_plot.grid_cells(data[i], colors=["black", COLORS[color]])
    channel_plot.title(f"{color} channel")

composite = figure.add_map()
composite.rgb_composite(data)
composite.title("RGB composite")

figure.title("RGB composite image at {time:%H:%M on %-d %B %Y}")

figure.show()