Categorical gridded data
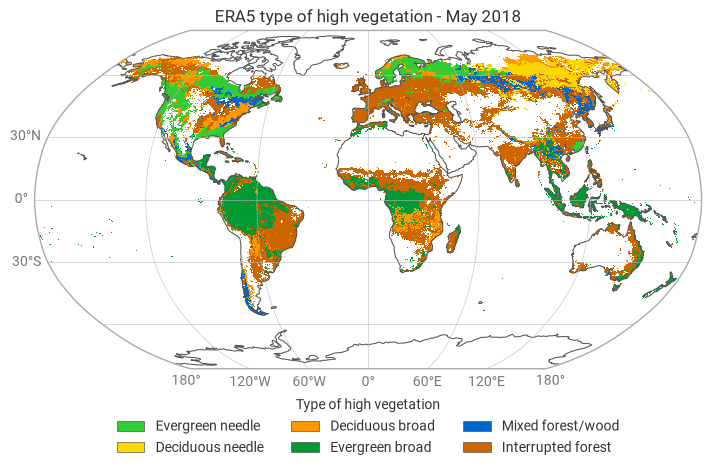
In this example, we will visualise “type of vegetation” data from the ERA5 reanalysis dataset in the C3S Climate Data Store.
[1]:
import earthkit.data as ekd
import earthkit.plots as ekp
To retrieve data from the CDS, we use the "cds" source type with earthkit.data.from_source. For more information, see the earthkit-data documentation page on retrieving data from the CDS.
[2]:
# data = ekd.from_source(
#     "cds",
#     "reanalysis-era5-single-levels-monthly-means",
#     {
#         "product_type": "monthly_averaged_reanalysis",
#         "year": "2018",
#         "month": "05",
#         "time": "00:00",
#         "data_format": "grib",
#         "download_format": "unarchived",
#         "variable": "type_of_high_vegetation",
#     },
# )

data = ekd.from_source("sample", "era5-vegetation-2018.grib")
From the ERA5 documentation, we know that the types of high vegetation are categorised with the following values:
0: No vegetation
3: Evergreen needle
4: Deciduous needle
5: Deciduous broad
6: Evergreen broad
18: Mixed forest/wood
19: Interrupted forest
Using a special Categorical style from earthkit plots, we can easily associate each value in the data with its category by passing the levels argument as a dictionary.
[3]:
style = ekp.styles.Categorical(
    levels={
        3: "Evergreen needle",
        4: "Deciduous needle",
        5: "Deciduous broad",
        6: "Evergreen broad",
        18: "Mixed forest/wood",
        19: "Interrupted forest",
    },
    colors=[
        "#33cc33",
        "#ffd700",
        "#ff9900",
        "#009933",
        "#0066cc",
        "#cc6600",
    ],
)
Now we can plot our data with this style:
[4]:
chart = ekp.Map(crs="Robinson")

chart.grid_cells(data, style=style)

chart.title("ERA5 {variable_name!l} - {time:%B %Y}")
chart.coastlines(resolution="low")
chart.gridlines()
chart.legend(location="bottom", label="{variable_name}", ncols=3)

chart.show()