Custom domains
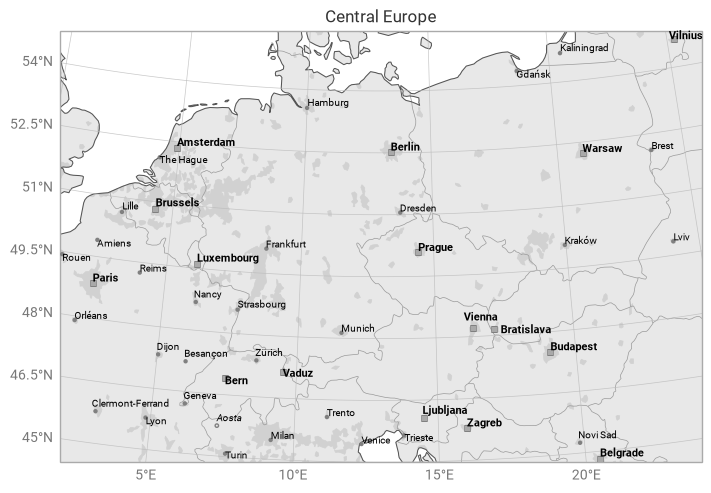
This example demonstrates how to construct your own custom domains in earthkit-plots. Note that bassing a bounding box like ekp.Map(domain=[2, 24, 45, 55]) is equally as valid as the approach below, but lacks metadata for titles and labels.
[1]:
import earthkit.plots as ekp
from earthkit.plots.geography import domains

central_europe = domains.Domain.from_bbox(
    bbox=[2, 24, 45, 55],
    name="Central Europe",
)

chart = ekp.Map(domain=central_europe)

chart.land()
chart.urban_areas()
chart.borders()
chart.cities(adjust_labels=True)
chart.coastlines()
chart.gridlines()

chart.title("{domain}")

chart.show()