Model Orography
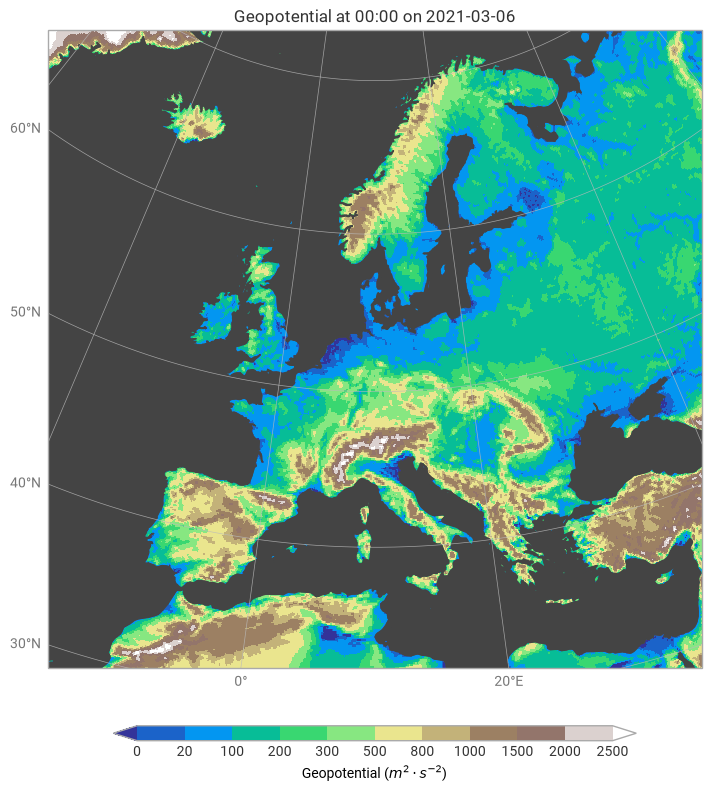
This example demonstrates plotting model orography.
[1]:
import earthkit.data as ekd
import earthkit.plots as ekp

data = ekd.from_source("url", "https://get.ecmwf.int/repository/test-data/metview/gallery/model_orog.grib").to_fieldlist()

levels = [
    0,
    20,
    100,
    200,
    300,
    500,
    800,
    1000,
    1500,
    2000,
    2500,
]

style = ekp.styles.Style(
    levels=levels,
    extend="both",
    colors="terrain",
    scale_factor=1 / 9.81,
)

ekp.geo.pcolormesh(
    data[0],
    style=style,
    domain=[-15, 35, 32, 72],
).ocean(
    color="#444",
).gridlines().show()
[1]:
<earthkit.plots.components.figures.Figure at 0x129adb610>