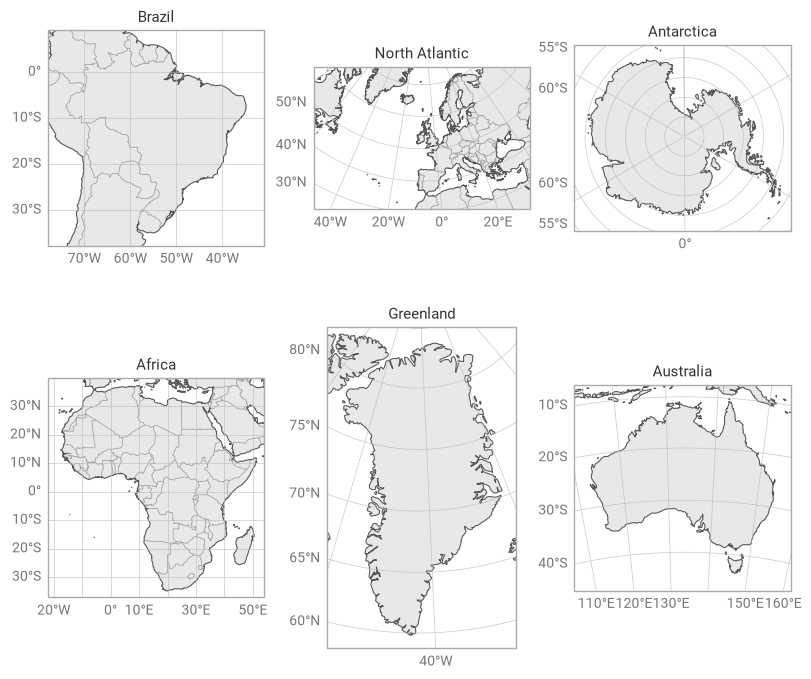
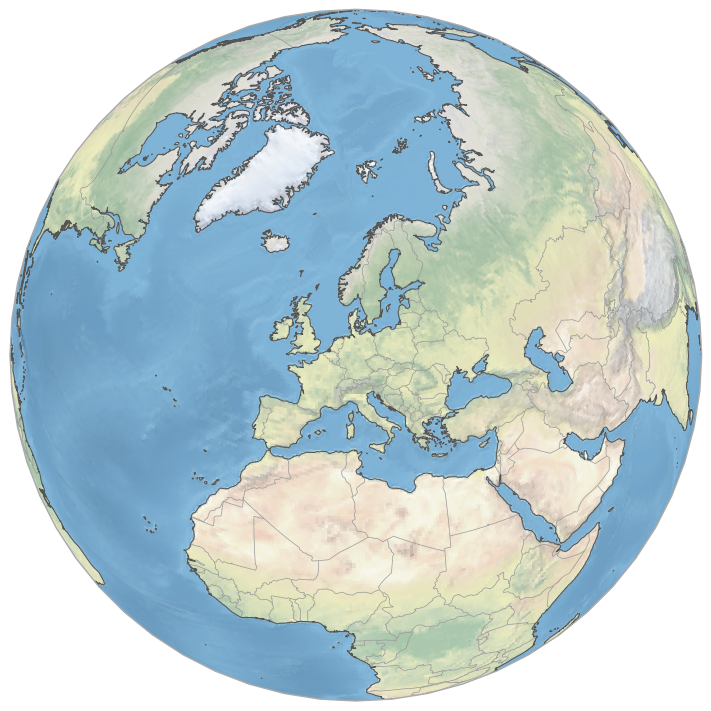
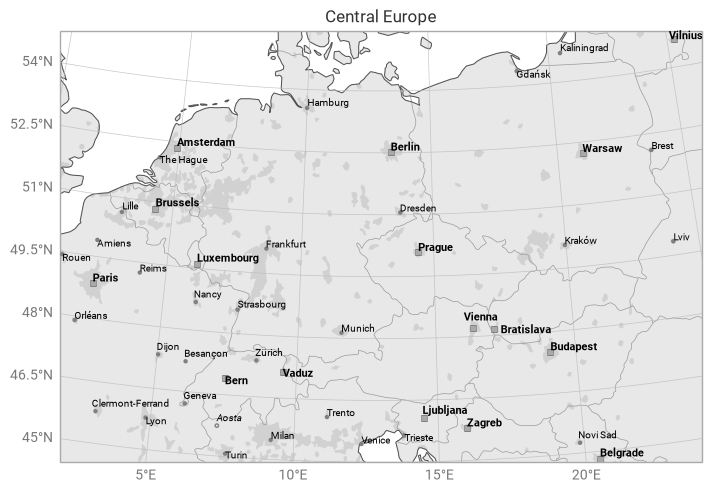
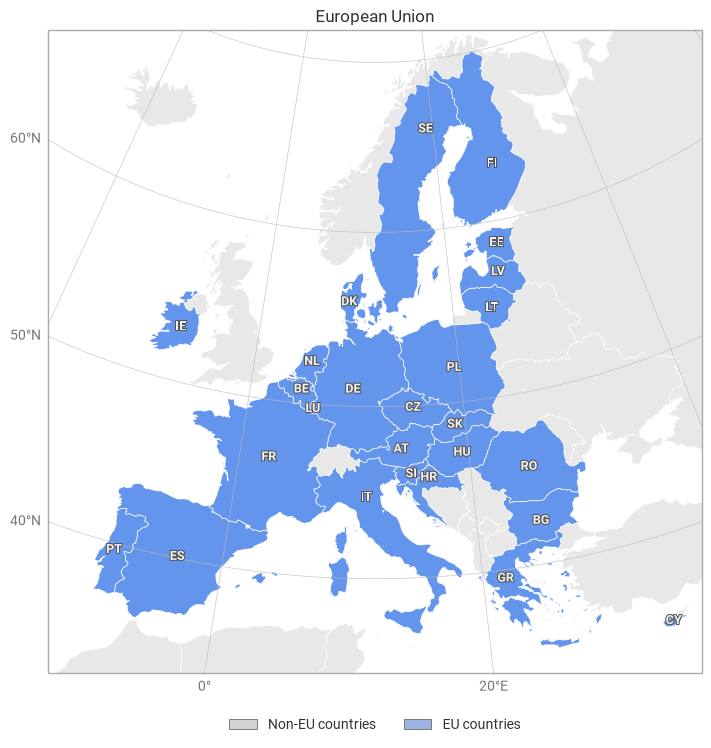
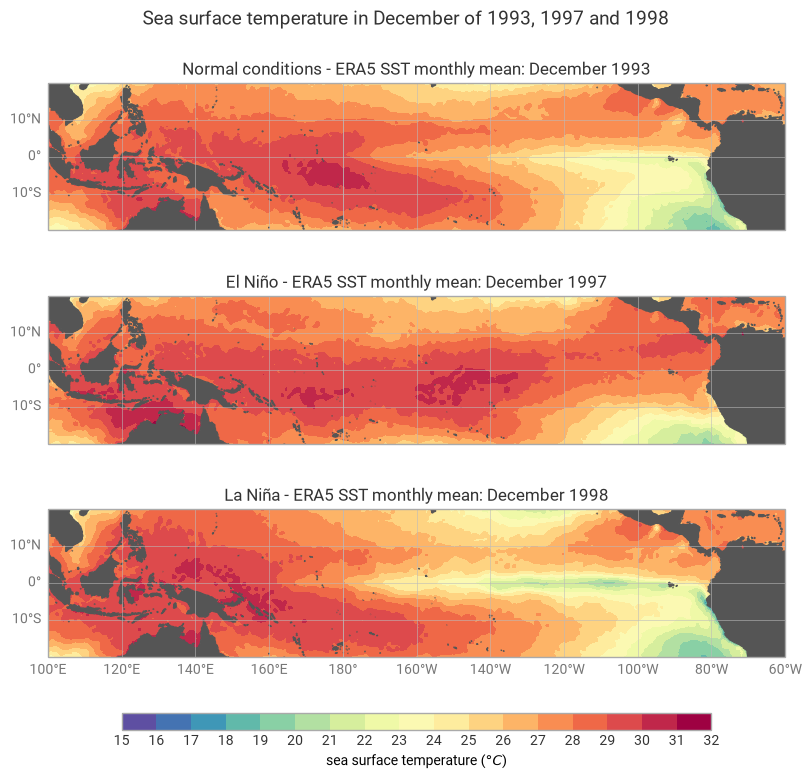
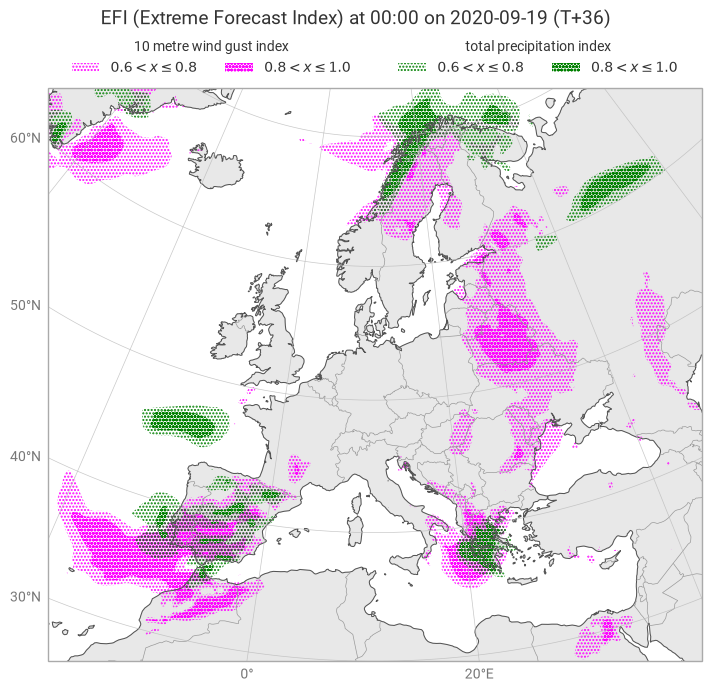
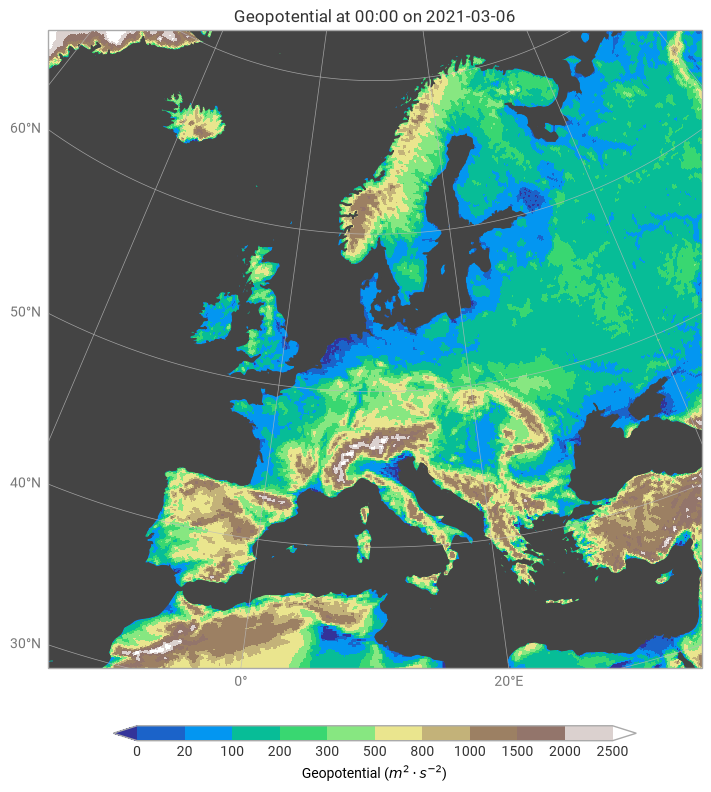
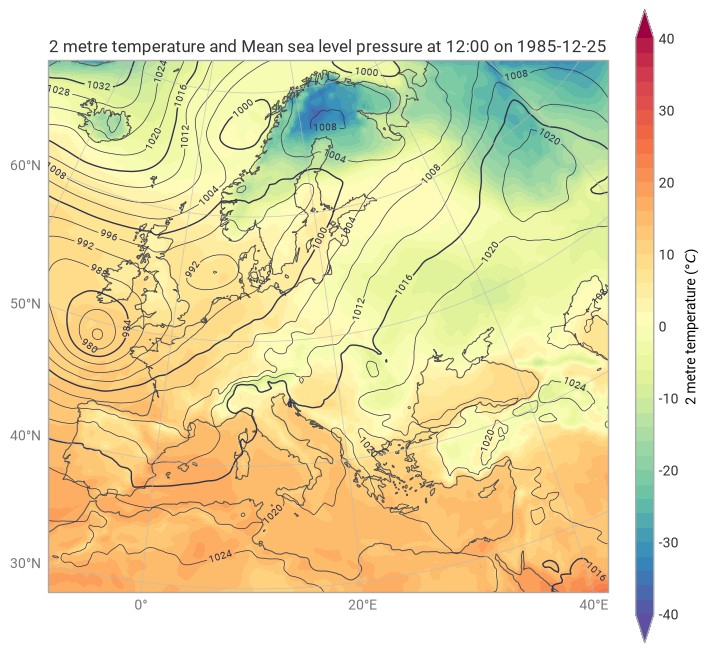
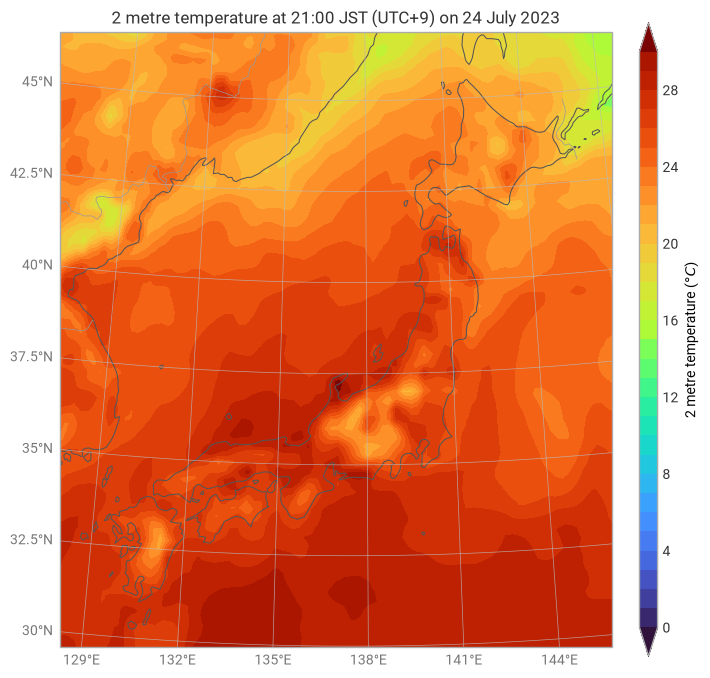
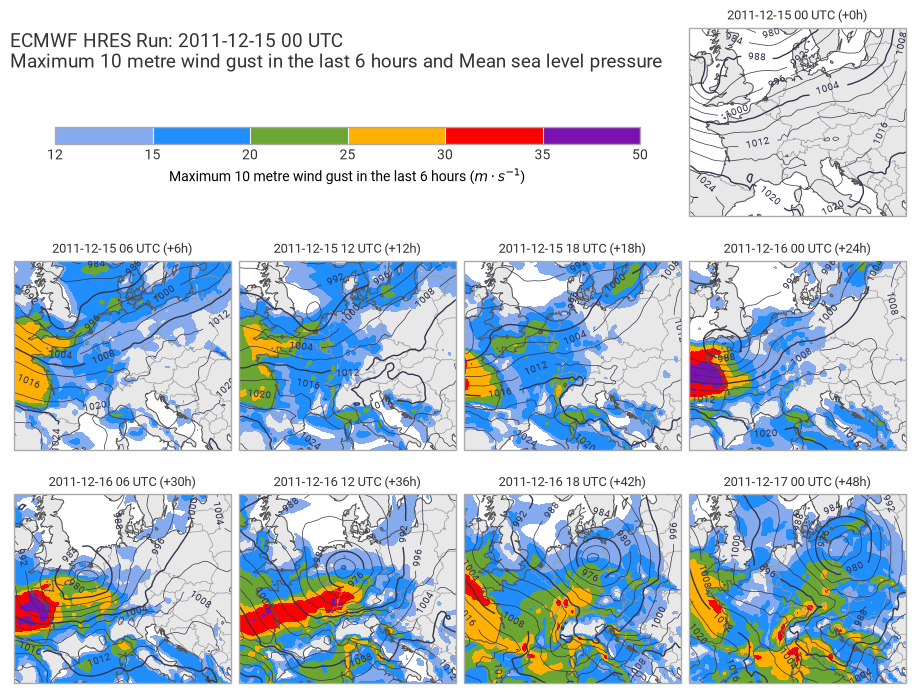
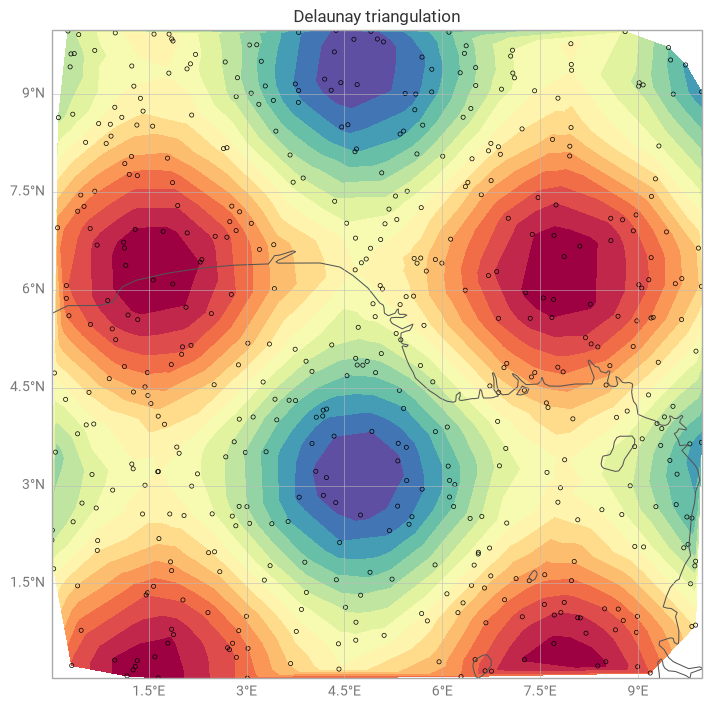
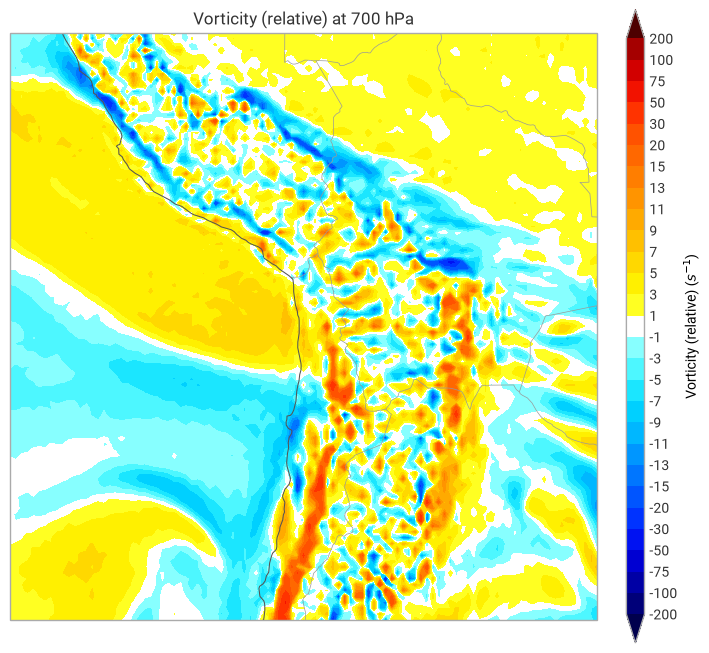
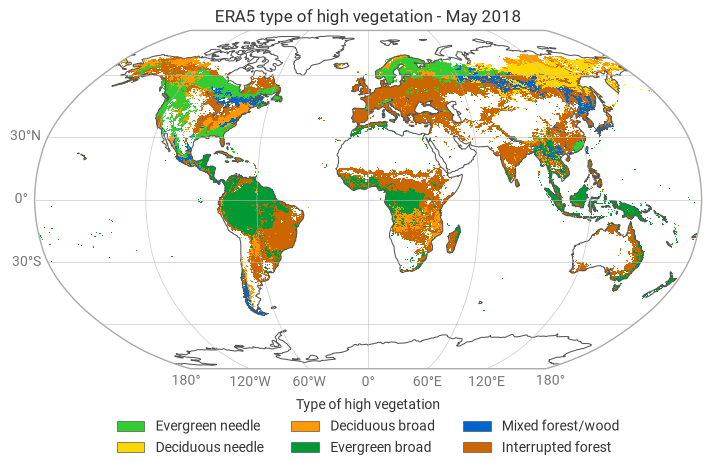
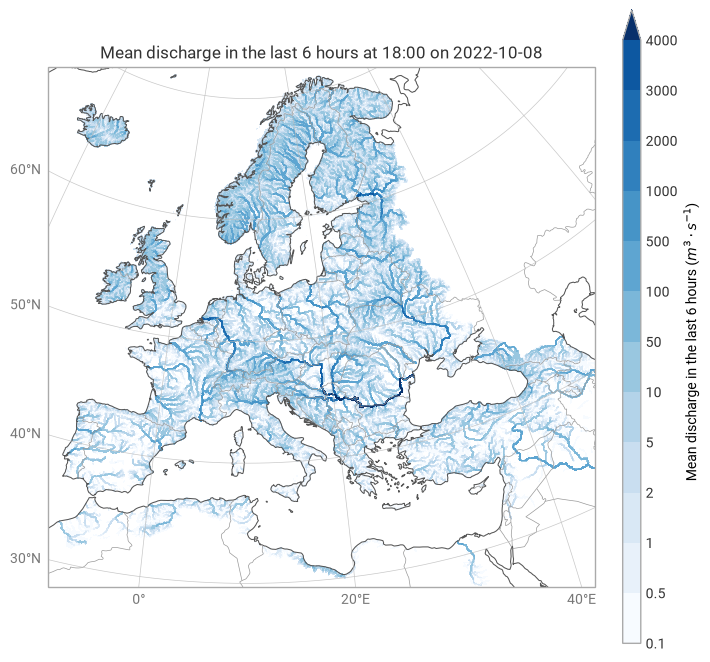
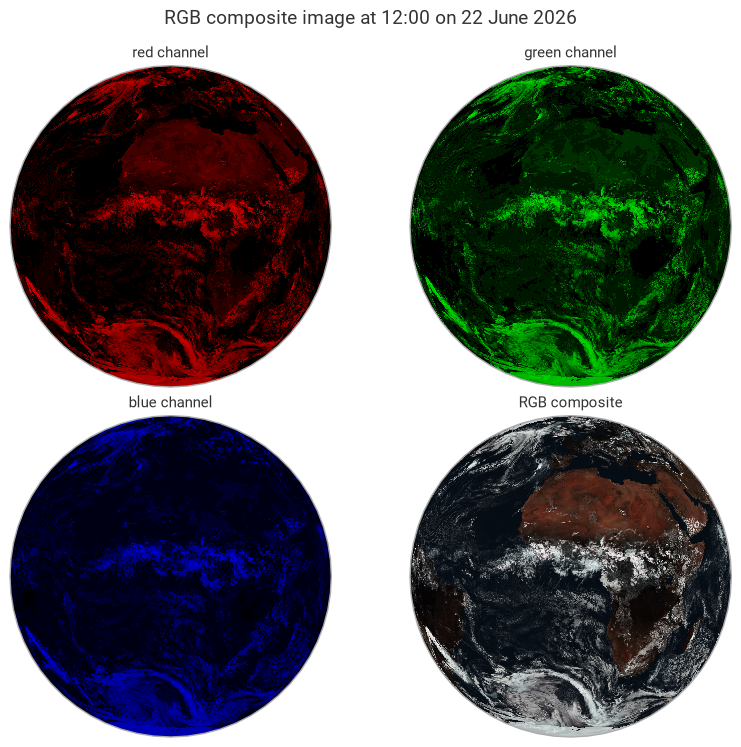
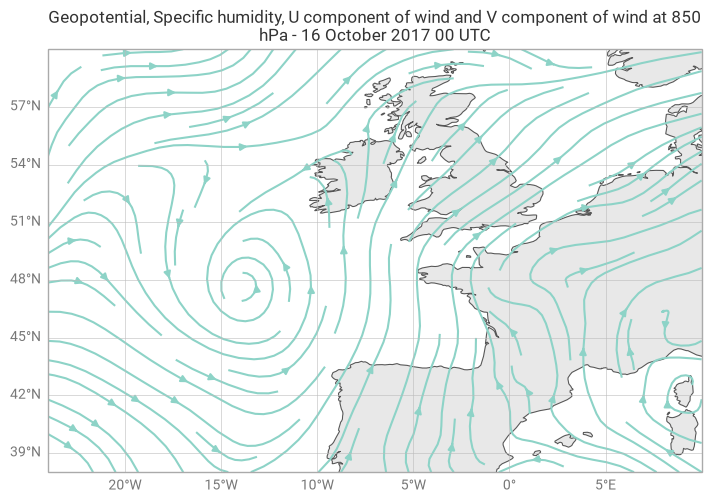
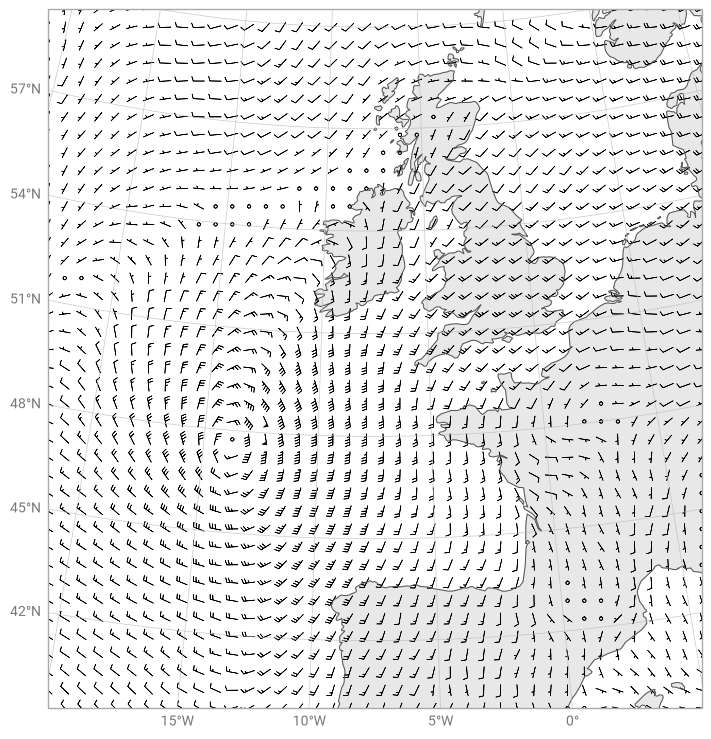
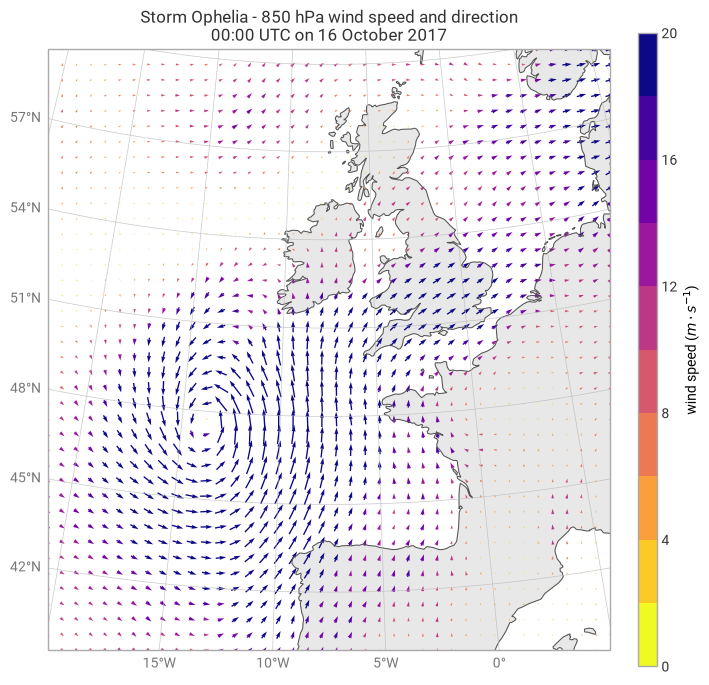
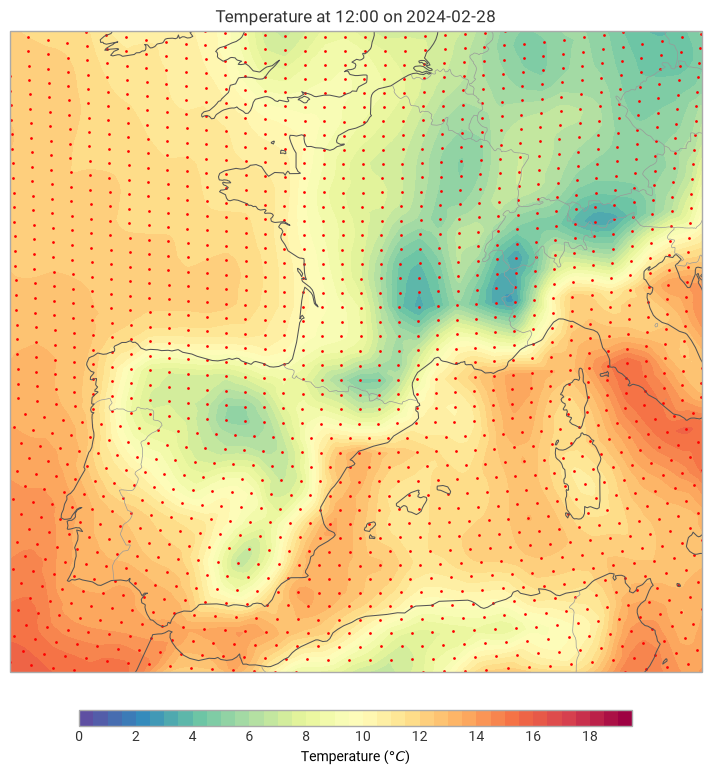
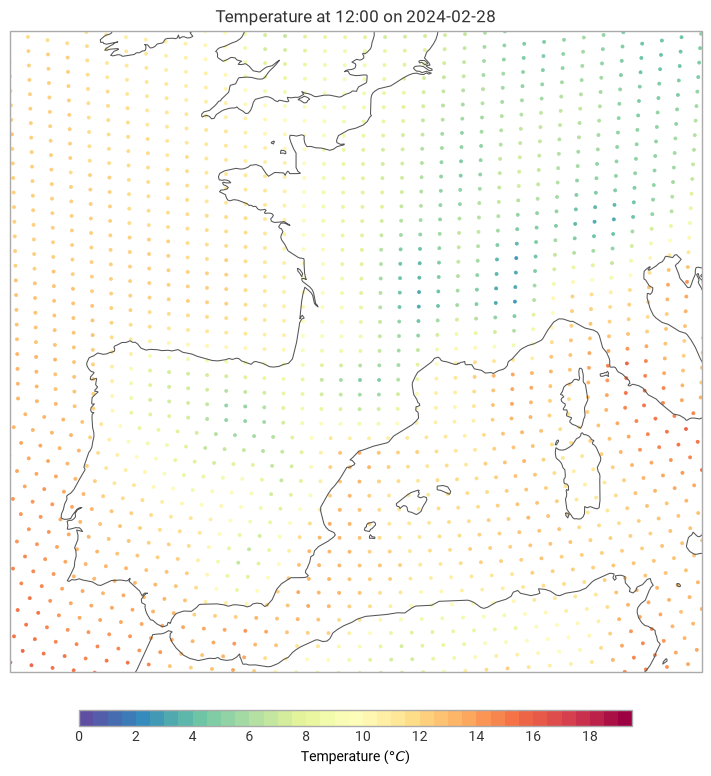
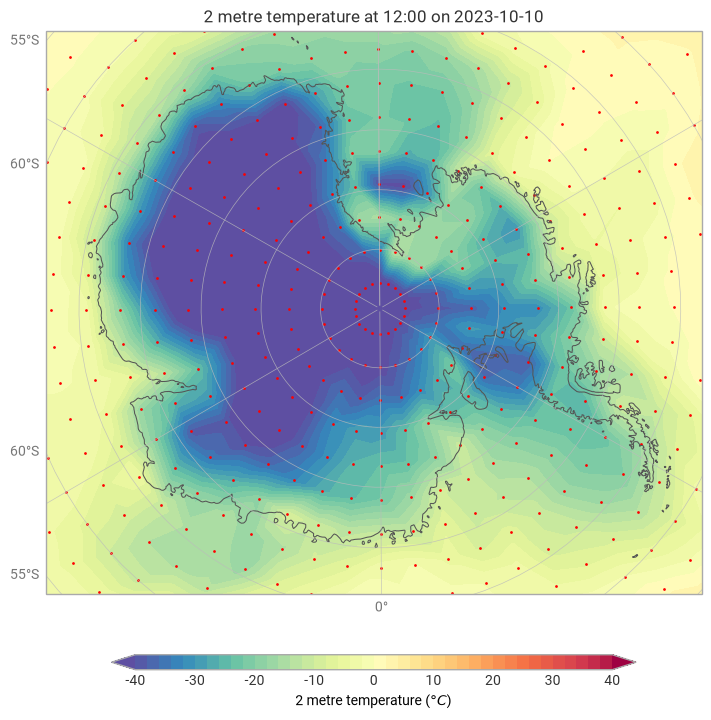
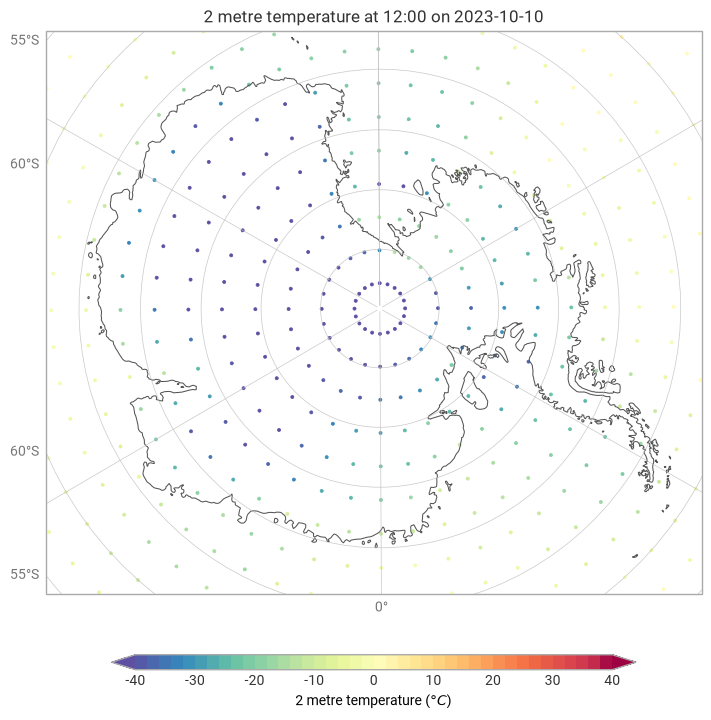
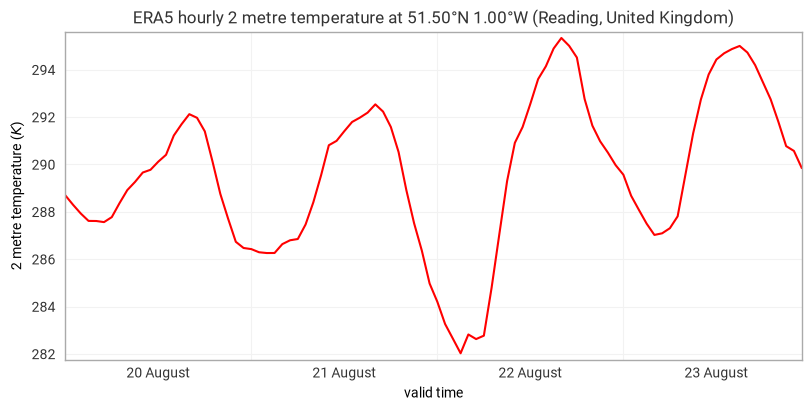
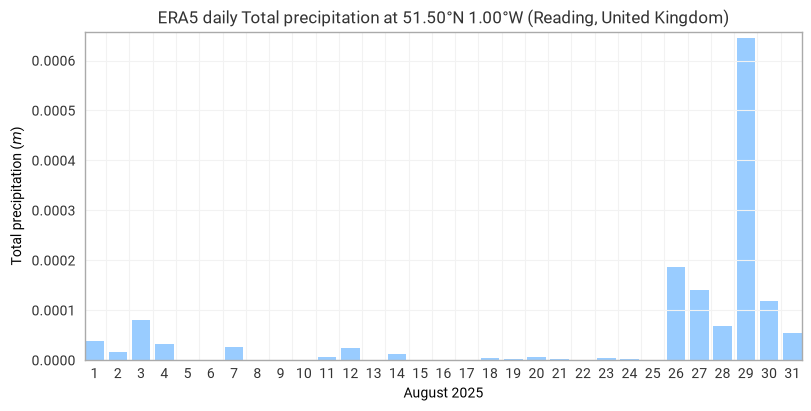
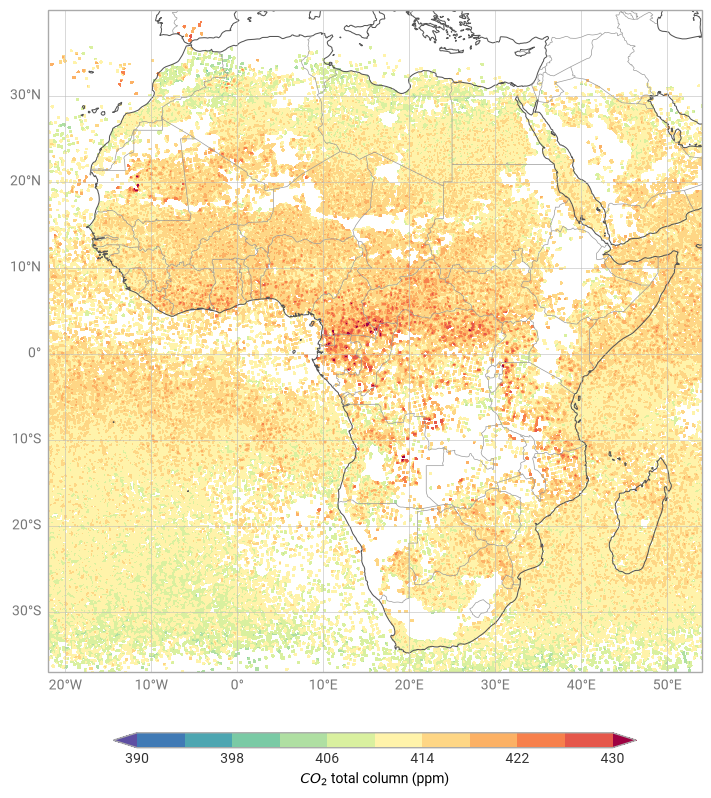
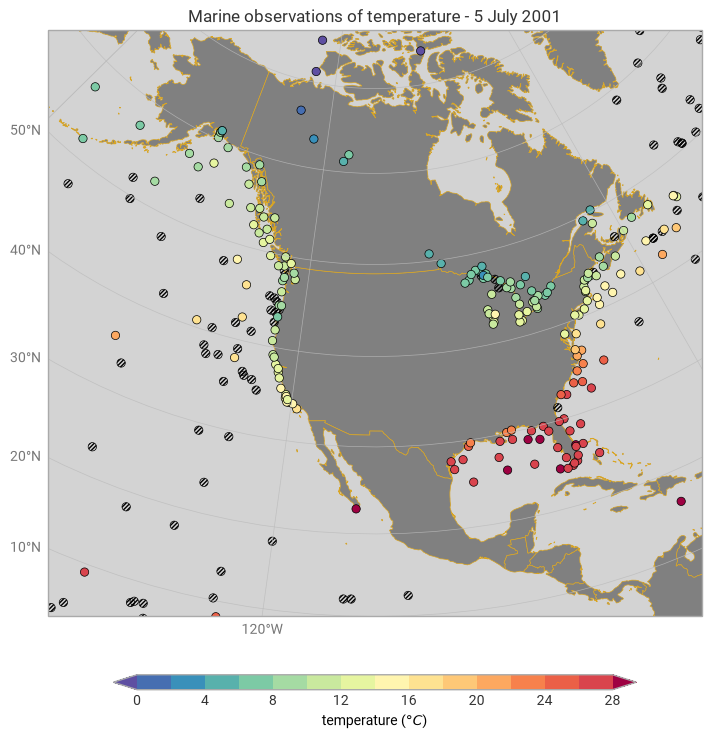
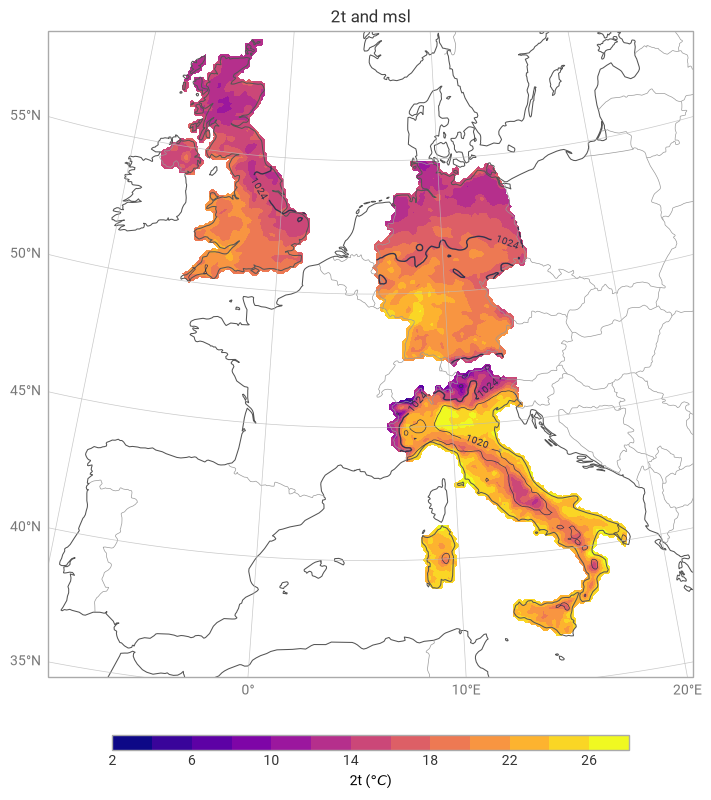
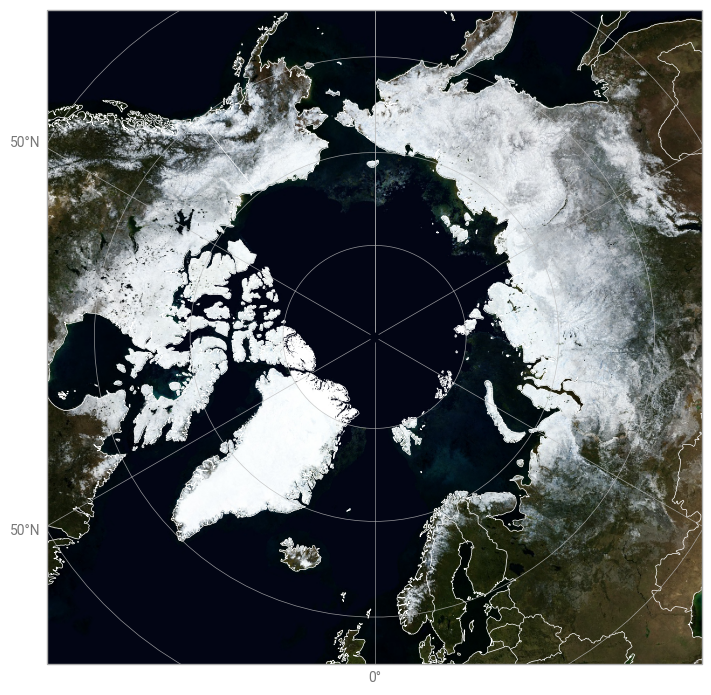
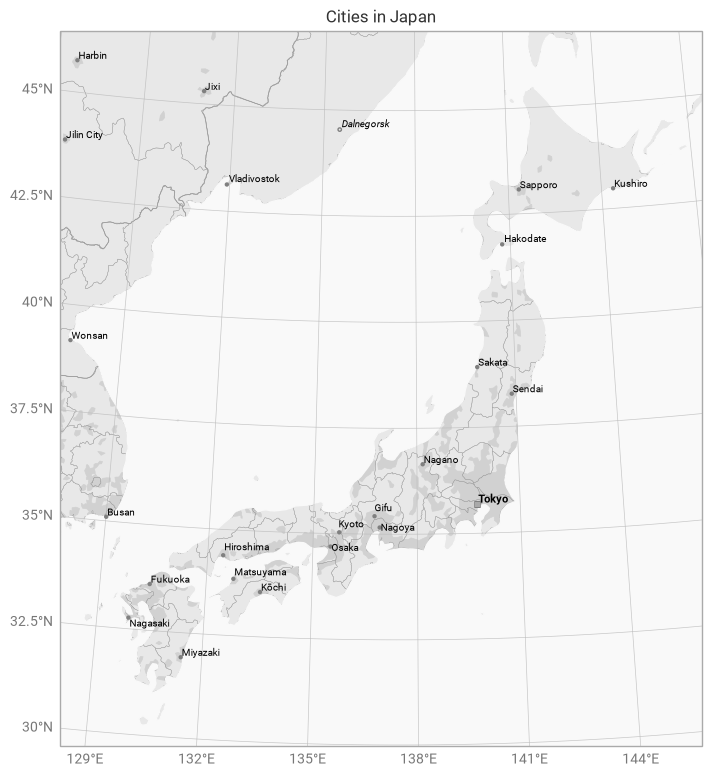
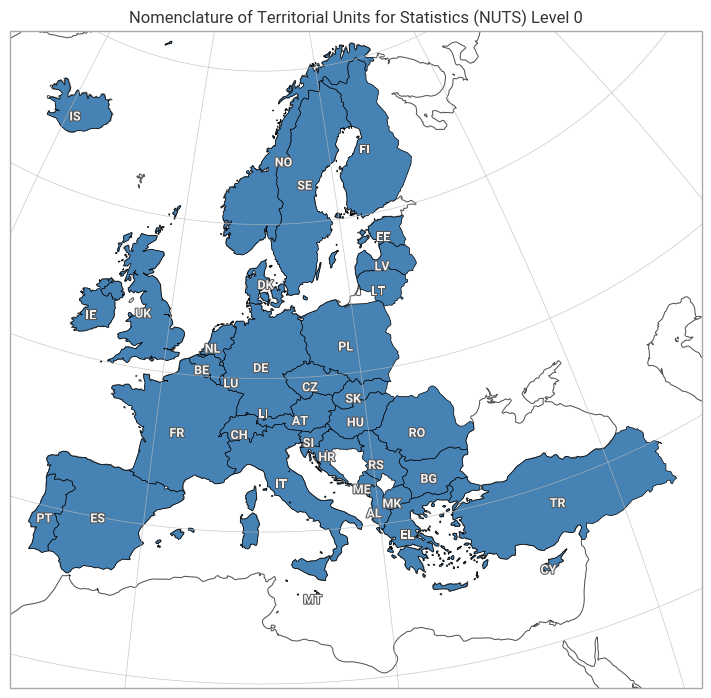
Contents Menu Expand Light mode Dark mode Auto light/dark, in light mode Auto light/dark, in dark mode Skip to content
earthkit-plots latest documentation
earthkit-plots earthkit-plots
  • Why earthkit-plots?

User guide

  • Installation
  • Tutorials
    • Introduction
    • Input and output
    • The functional and object-oriented APIs
    • The object-oriented API
    • Layouts and Figures
    • Styles
    • Metadata formatting
    • Domains and projections
    • Unit conversion
    • Regular lat-lon
    • Reduced Gaussian
    • HEALPix
    • ORCA
    • Wind barbs
    • Quiver (wind arrows)
    • Streamplots
    • Vector subsampling
    • Vector interpolation
    • Vector styles
    • Introduction to contour lines
    • Contour line styles
    • Reusable contour styles
    • Loading the data
    • Inspecting the data
    • Selecting a single valid time
    • Examining the ensemble structure
    • Plotting the spaghetti
    • Introduction to filled contours
    • Filled contour styles
    • Combining filled contours and contour lines
    • Point cloud
    • Grid points
    • Grid cells
    • Scatter
    • Choropleth maps
    • RGB composite images
    • Bilinear interpolation
    • Nearest-neighbour resampling
    • Regrid
    • Subsampling
    • Plotting numpy arrays
    • Plotting netCDF data
    • Plotting GRIB data
    • Plotting xarray data
    • Introduction to time series plots
    • Climate stripe plots
    • Multi-box plots
  • Gallery
    • Built-in named domains
    • Using a cartopy CRS
    • Custom domains
    • Combining domains
    • El Niño
    • Hatched shading
    • Model orography
    • Temperature and pressure
    • Time zones
    • Weather forecast steps
    • Unstructured grids
    • Vorticity over the Andes
    • Categorical data
    • EFAS (Lambert Azimuthal Equal Area)
    • RGB composite
    • Numpy arrays
    • Streamlines
    • Wind barbs/flags
    • Wind arrows/quiver
    • Quiver with colours
    • HEALPix pixels
    • HEALPix interpolated
    • HEALPix point cloud
    • Octahedral grid pixels
    • Octahedral grid interpolated
    • Octahedral grid point cloud
    • ERA5 temperature time series
    • ERA5 precipitation time series
    • Satellite level 2 (orbit tracks) CO2 data
    • USA temperature obs
    • Non-contiguous gridded data
    • Blue marble JPEG
    • Cities in Japan
    • Shapefiles
  • Styles gallery
  • Named domains
  • API Reference
    • earthkit.plots.Figure
    • earthkit.plots.Subplot
    • earthkit.plots.geo
    • earthkit.plots.timeseries
    • earthkit.plots.climatology
    • earthkit.plots.quickplot
    • earthkit.plots.Style
    • earthkit.plots.load_style
    • earthkit.plots.list_styles
    • earthkit.plots.metadata.formatters
    • earthkit.plots.metadata.labels

Developer guide

  • Development

Extras

  • Release notes
    • Deprecations
    • Version 1.0 Updates
    • Version 0.6 Updates
    • Version 0.5 Updates
    • Version 0.4 Updates
    • Version 0.3 Updates
  • License
  • Index
Back to top
View this page
Edit this page

Gallery

Domains and projections

Built-in named domains
Using a cartopy CRS
Custom domains
Combining domains

Gridded data

El Niño
Hatched shading
Model orography
Temperature and pressure
Time zones
Weather forecast steps
Unstructured grids
Vorticity over the Andes
Categorical data
EFAS (Lambert Azimuthal Equal Area)
RGB composite
Numpy arrays

Vector data

Streamlines
Wind barbs/flags
Wind arrows/quiver
Quiver with colours

Grid types

HEALPix pixels
HEALPix interpolated
HEALPix point cloud
Octahedral grid pixels
Octahedral grid interpolated
Octahedral grid point cloud

Time series plots (experimental)

ERA5 temperature time series
ERA5 precipitation time series

Point data and unstructured data

Satellite level 2 (orbit tracks) CO2 data
USA temperature obs
Non-contiguous gridded data

Ancillary data

Blue marble JPEG
Cities in Japan
Shapefiles
Next
Built-in named domains
Previous
Ensemble spread as a multiboxplot
Copyright © 2026, European Centre for Medium-Range Weather Forecasts (ECMWF)
Made with Sphinx and @pradyunsg's Furo
On this page
  • Gallery
    • Domains and projections
    • Gridded data
    • Vector data
    • Grid types
    • Time series plots (experimental)
    • Point data and unstructured data
    • Ancillary data