Vector data - streamplots
This notebook introduces how to plot vector data, such as wind fields, as streamplots using earthkit-plots. Vector data typically consists of U (zonal, east-west) and V (meridional, north-south) components, which are often visualised as arrows or flags.
Example: Wind from Storm Ophelia (October 2017)
In this example, we will use sample wind data from Storm Ophelia, which impacted the UK in October 2017.
[1]:
import earthkit.data as ekd

import earthkit.plots as ekp

data = ekd.from_source("sample", "storm_ophelia_wind_850.grib").to_fieldlist()
data.ls()
[1]:
| parameter.variable | time.valid_datetime | time.base_datetime | time.step | vertical.level | vertical.level_type | ensemble.member | geography.grid_type | |
|---|---|---|---|---|---|---|---|---|
| 0 | u | 2017-10-16 | 2017-10-16 | 0 days | 850 | pressure | 0 | regular_ll |
| 1 | v | 2017-10-16 | 2017-10-16 | 0 days | 850 | pressure | 0 | regular_ll |
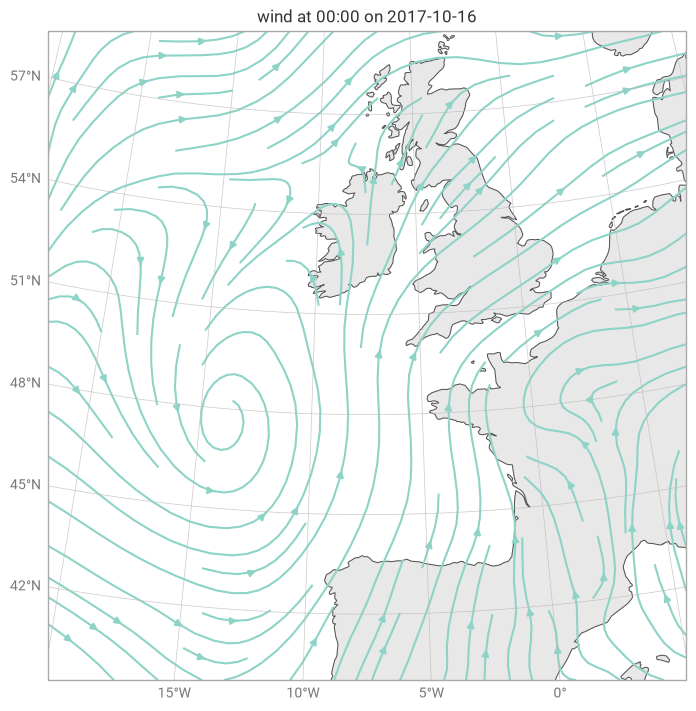
This dataset contains U (zonal wind) and V (meridional wind) components, which earthkit-plots can automatically detect and extract. To plot this data as a streamplot, we can use the streamplot function:
[2]:
chart = ekp.geo.streamplot(data, domain=[-20, 5, 40, 59])

# Add map features
chart.land()
chart.gridlines()

# Show the plot
chart.show()
[2]:
<earthkit.plots.components.figures.Figure at 0x138303950>
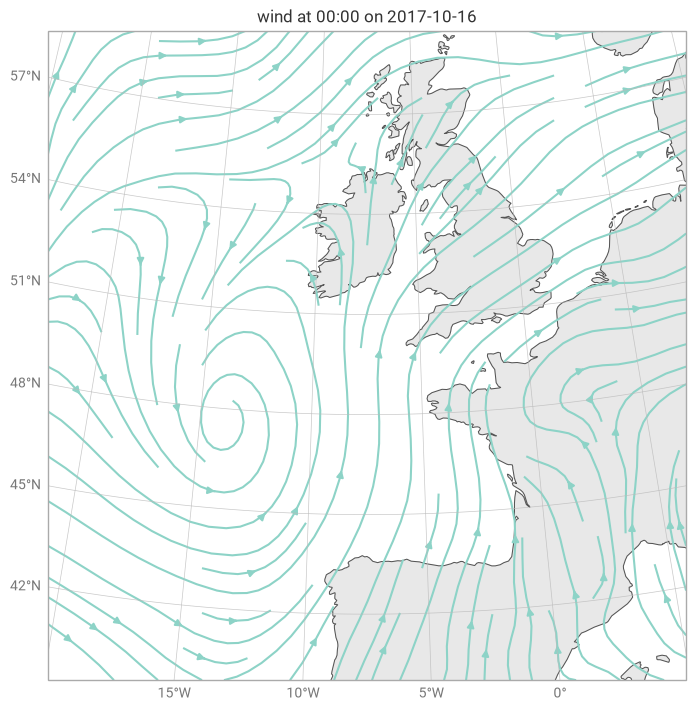
Alternatively, you can explicitly provide U and V components as u and v arguments. This can be useful when working with datasets that store U and V components separately or which use non-standard metadata.
[3]:
# Create a map of the region around the UK
chart = ekp.geo.streamplot(u=data[0], v=data[1], domain=[-20, 5, 40, 59])

# Add map features
chart.land()
chart.gridlines()

# Show the plot
chart.show()
[3]:
<earthkit.plots.components.figures.Figure at 0x14a345510>
Next Steps
Continue exploring the topics in this section to expand your knowledge of vector plotting, including:
Wind flags/barbs: Learn how to plot vectors using wind barbs.
Resampling and Regridding: Discover how to manage vector density for clearer plots.
Applying Styles: Customise vector colours, lengths, and arrow styles.