Ocathedral grid cells
[1]:
import earthkit.data
import earthkit.plots
[2]:
data = earthkit.data.from_source(
    "url",
    "https://get.ecmwf.int/repository/test-data/earthkit-regrid/test-data/global_0_360/O32.grib",
)

data.ls()
[2]:
| centre | shortName | typeOfLevel | level | dataDate | dataTime | stepRange | dataType | number | gridType | |
|---|---|---|---|---|---|---|---|---|---|---|
| 0 | ecmf | 2t | surface | 0 | 20231010 | 1200 | 0 | an | 0 | reduced_gg |
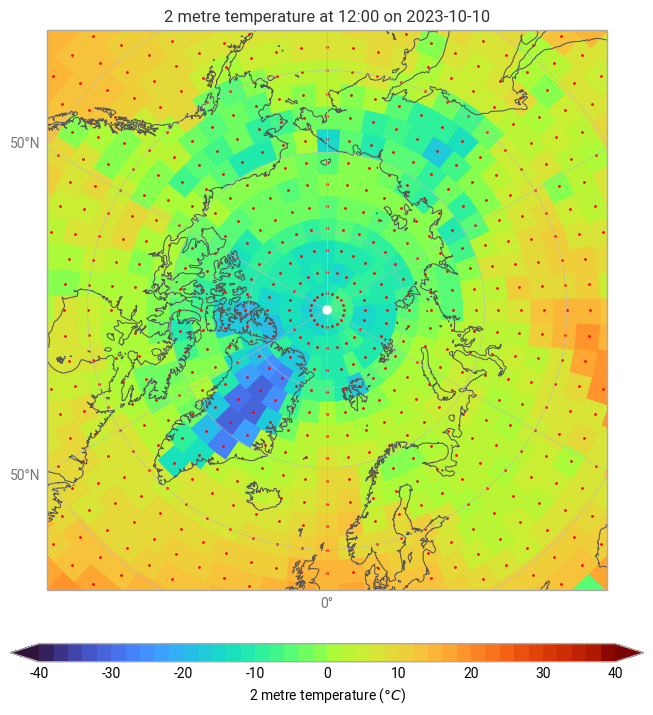
[3]:
chart = earthkit.plots.Map(domain="Arctic")

chart.grid_cells(data, units="celsius", auto_style=True)
chart.grid_points(data)

chart.title()
chart.legend()

chart.coastlines()
chart.gridlines()

chart.show()