Lambert Azimuthal Equal Area
[1]:
import earthkit.data
import earthkit.plots
[2]:
earthkit.data.download_example_file("efas.nc")
data = earthkit.data.from_source("file", "efas.nc")
data.ls()
[2]:
| variable | level | valid_datetime | units | |
|---|---|---|---|---|
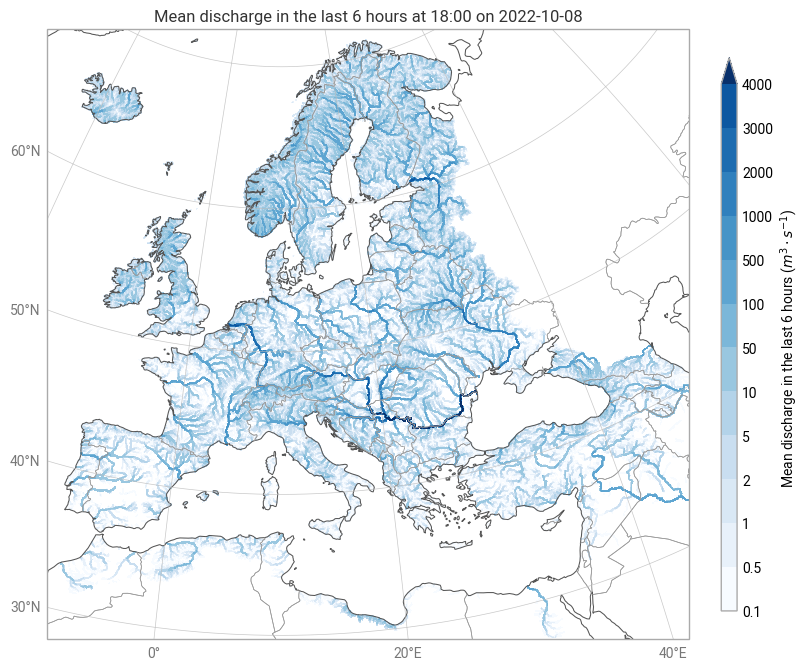
| 0 | dis06 | None | 2022-10-08T18:00:00 | m**3 s**-1 |
| 1 | land_binary_mask | None | 2022-10-08T18:00:00 | 1 |
| 2 | upArea | None | 2022-10-08T18:00:00 | M2 |
[3]:
style = earthkit.plots.styles.Style(
    colors="Blues",
    levels=[0.1, 0.5, 1, 2, 5, 10, 50, 100, 500, 1000, 2000, 3000, 4000],
    extend="max",
    units="m3 s-1",
)
[5]:
chart = earthkit.plots.Map()

chart.plot(data[0], style=style)

chart.title()
chart.legend(location="right")

chart.coastlines()
chart.borders()
chart.gridlines()

chart.show()