[1]:
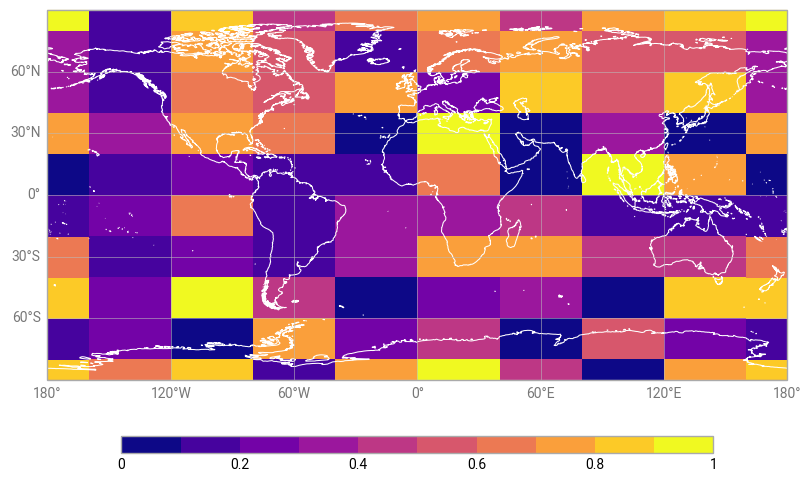
import earthkit.plots
import numpy as np

chart = earthkit.plots.Map()

chart.plot(
    np.random.rand(10, 10),
    y=np.linspace(-90, 90, 10),
    x=np.linspace(-180, 180, 10),
)

chart.coastlines(color="white")
chart.gridlines()
chart.legend(label="")
chart.show()