import earthkit.plots
EU_COUNTRIES = [
'Austria',
'Belgium',
'Bulgaria',
'Croatia',
'Cyprus',
'Czech Republic',
'Denmark',
'Estonia',
'Finland',
'France',
'Germany',
'Greece',
'Hungary',
'Ireland',
'Italy',
'Latvia',
'Lithuania',
'Luxembourg',
'Netherlands',
'Poland',
'Portugal',
'Romania',
'Slovakia',
'Slovenia',
'Spain',
'Sweden',
]
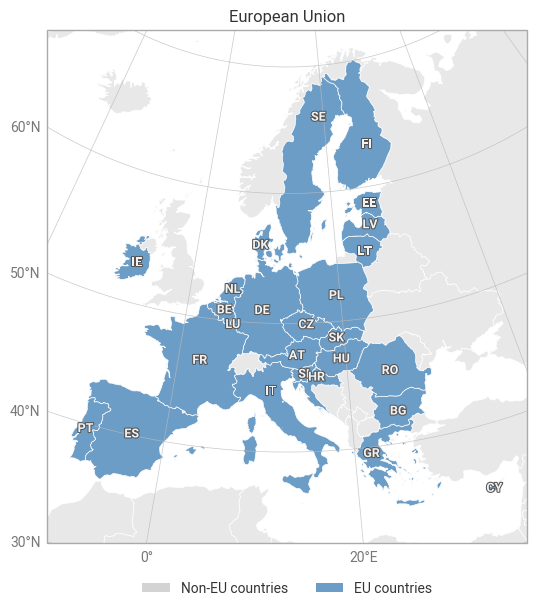
EU = earthkit.plots.geo.domains.union(EU_COUNTRIES, name="European Union")
eu_map = earthkit.plots.Map(domain=EU)
eu_map.countries(edgecolor="white")
# We can reuse the same list of EU countries to show a subset of country polygons
eu_map.countries(include=EU_COUNTRIES, facecolor="#6c9dc6", edgecolor="white", labels=True)
eu_map.gridlines()
eu_map.title("{domain}")
# You can pass an earthkit-plots Style directly to the legend method
eu_map.legend(
earthkit.plots.styles.Categorical(
categories=["Non-EU countries", "EU countries"],
colors=["lightgrey", "#6c9dc6"],
)
)
eu_map.show()