[1]:
import earthkit.data
import earthkit.plots
import cartopy.crs as ccrs

temperature, pressure = earthkit.data.from_source(
    'cds',
    'reanalysis-era5-single-levels',
    {
        'product_type': 'reanalysis',
        'variable': [
            '2m_temperature',
            "mean_sea_level_pressure",
        ],
        'year': '1985',
        'month': '12',
        'day': '25',
        'time': '12:00',
    },
)
2024-08-29 10:41:13,493 INFO Welcome to the CDS.
 As per our announcements on the Forum, this instance of CDS will soon be decommissioned.
 Please update your cdsapi package to a version >=0.7.0, create an account on CDS-Beta and update your .cdsapirc file. We strongly recommend users to check our Guidelines at https://confluence.ecmwf.int/x/uINmFw
 The current legacy system will be kept for a while, but we will reduce resources gradually until full decommissioning in September 2024.
2024-08-29 10:41:13,493 WARNING MOVE TO CDS-Beta
2024-08-29 10:41:13,494 INFO Sending request to https://cds.climate.copernicus.eu/api/v2/resources/reanalysis-era5-single-levels
2024-08-29 10:41:13,601 INFO Request is completed
2024-08-29 10:41:13,603 INFO Downloading https://download-0009-clone.copernicus-climate.eu/cache-compute-0009/cache/data4/adaptor.mars.internal-1724918995.7584715-1428-17-38c1b73e-8213-4075-8297-9e1412421c05.grib to /var/folders/vt/7j2c2tmx4m14gn_sg3zpf5l00000gn/T/tmp41qz1dnc/cds-retriever-850c5d019e1723df7d3daf40c10d877f8bfe2935c16ca95fab24801b9559e3a5.cache.tmp (4M)
2024-08-29 10:41:14,349 INFO Download rate 5.3M/s
[2]:
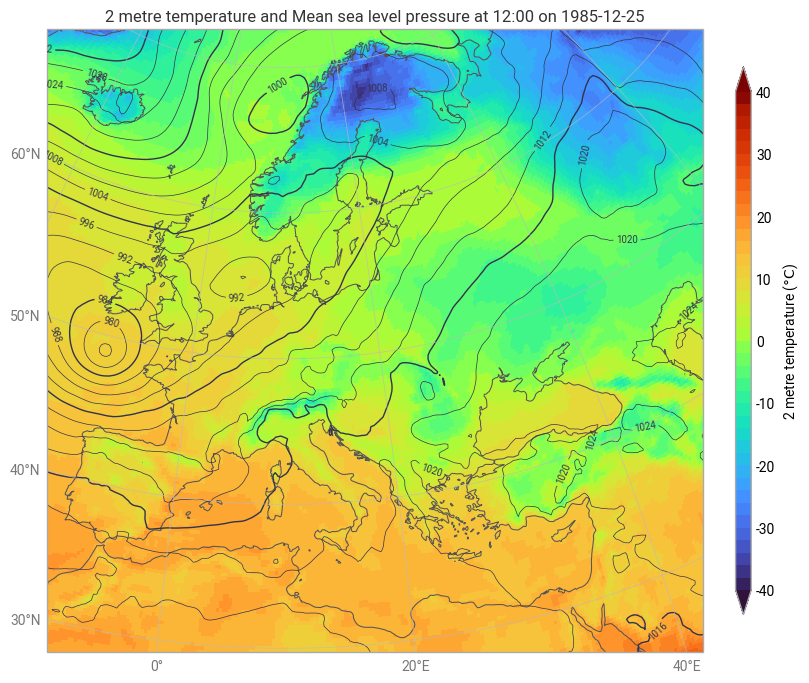
chart = earthkit.plots.Map(domain="Europe")

chart.plot(temperature, units="celsius")
chart.contour(pressure, units="hPa")

chart.legend(location="right")

chart.coastlines()

chart.title()
chart.gridlines()


chart.show()