[1]:
import earthkit.data
import earthkit.plots
import cartopy.crs as ccrs

temperature, pressure = earthkit.data.from_source(
    'cds',
    'reanalysis-era5-single-levels',
    {
        'product_type': 'reanalysis',
        'variable': [
            '2m_temperature',
            "mean_sea_level_pressure",
        ],
        'year': '1985',
        'month': '12',
        'day': '25',
        'time': '12:00',
    },
)
2024-06-16 19:21:35,577 INFO Welcome to the CDS
2024-06-16 19:21:35,581 INFO Sending request to https://cds.climate.copernicus.eu/api/v2/resources/reanalysis-era5-single-levels
2024-06-16 19:21:35,672 INFO Request is completed
2024-06-16 19:21:35,674 INFO Downloading https://download-0006-clone.copernicus-climate.eu/cache-compute-0006/cache/data9/adaptor.mars.internal-1718562015.36262-27420-17-abfac866-aa93-4dab-8dae-12ad2b408adf.grib to /var/folders/vt/7j2c2tmx4m14gn_sg3zpf5l00000gn/T/tmpmdlxxgcx/cds-retriever-57a952a86e9dfdfd90b2608359bce7d56cb86d7d145db8a4dec54f6d1304bece.cache.tmp (4M)
2024-06-16 19:21:36,314 INFO Download rate 6.2M/s
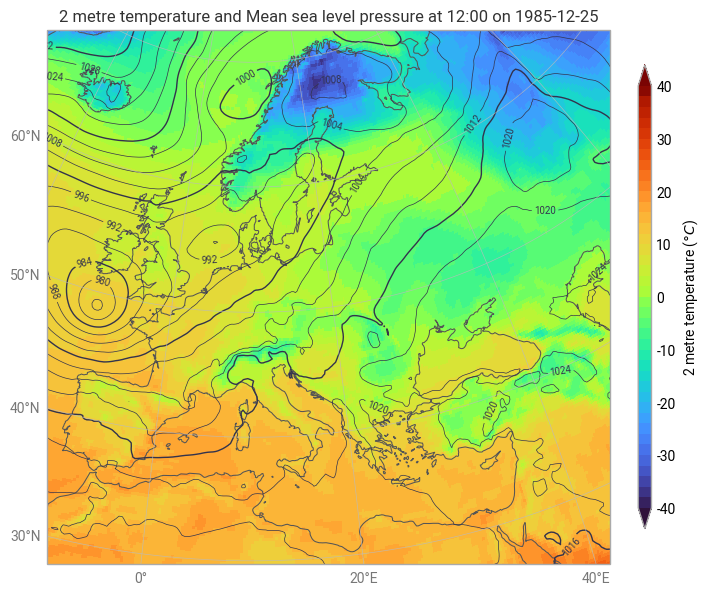
[2]:
chart = earthkit.plots.Map(domain="Europe")

chart.plot(temperature, units="celsius")
chart.contour(pressure, units="hPa")

chart.legend(location="right")

chart.coastlines()

chart.title()
chart.gridlines()


chart.show()