[1]:
import earthkit.plots
from earthkit.plots.geo import domains
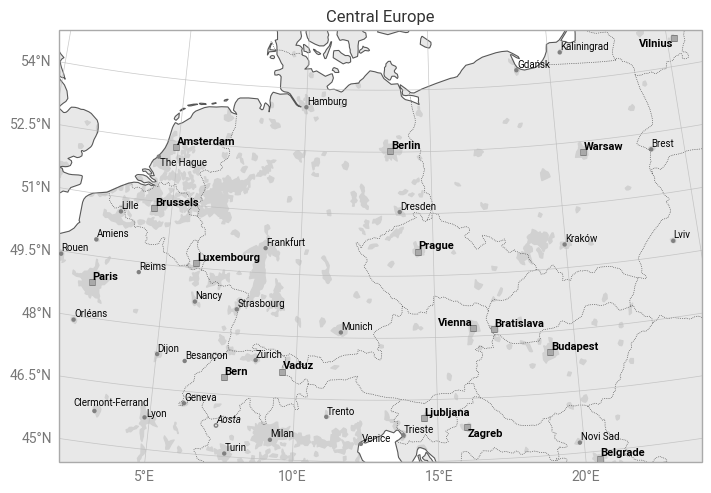
central_europe = domains.Domain.from_bbox(
bbox=[2, 24, 45, 55],
name="Central Europe",
)
chart = earthkit.plots.Map(domain=central_europe)
chart.land()
chart.urban_areas()
chart.borders()
chart.cities(adjust_labels=True)
chart.coastlines()
chart.gridlines()
chart.title("{domain}")
chart.show()