Welcome to the earthkit-plots documentation
Warning
This project is in the BETA stage of development. Please be aware that interfaces and functionality may change as the project develops. If this software is to be used in operational systems you are strongly advised to use a released tag in your system configuration, and you should be willing to accept incoming changes and bug fixes that require adaptations on your part. ECMWF does use this software in operations and abides by the same caveats.
earthkit-plots is a Python package for producing publication-quality weather and climate graphs and maps using a simple API and a convenient library of templates.
earthkit-plots makes it possible to generate automatic visualisations driven by an understanding of common weather and climate science metadata standards.
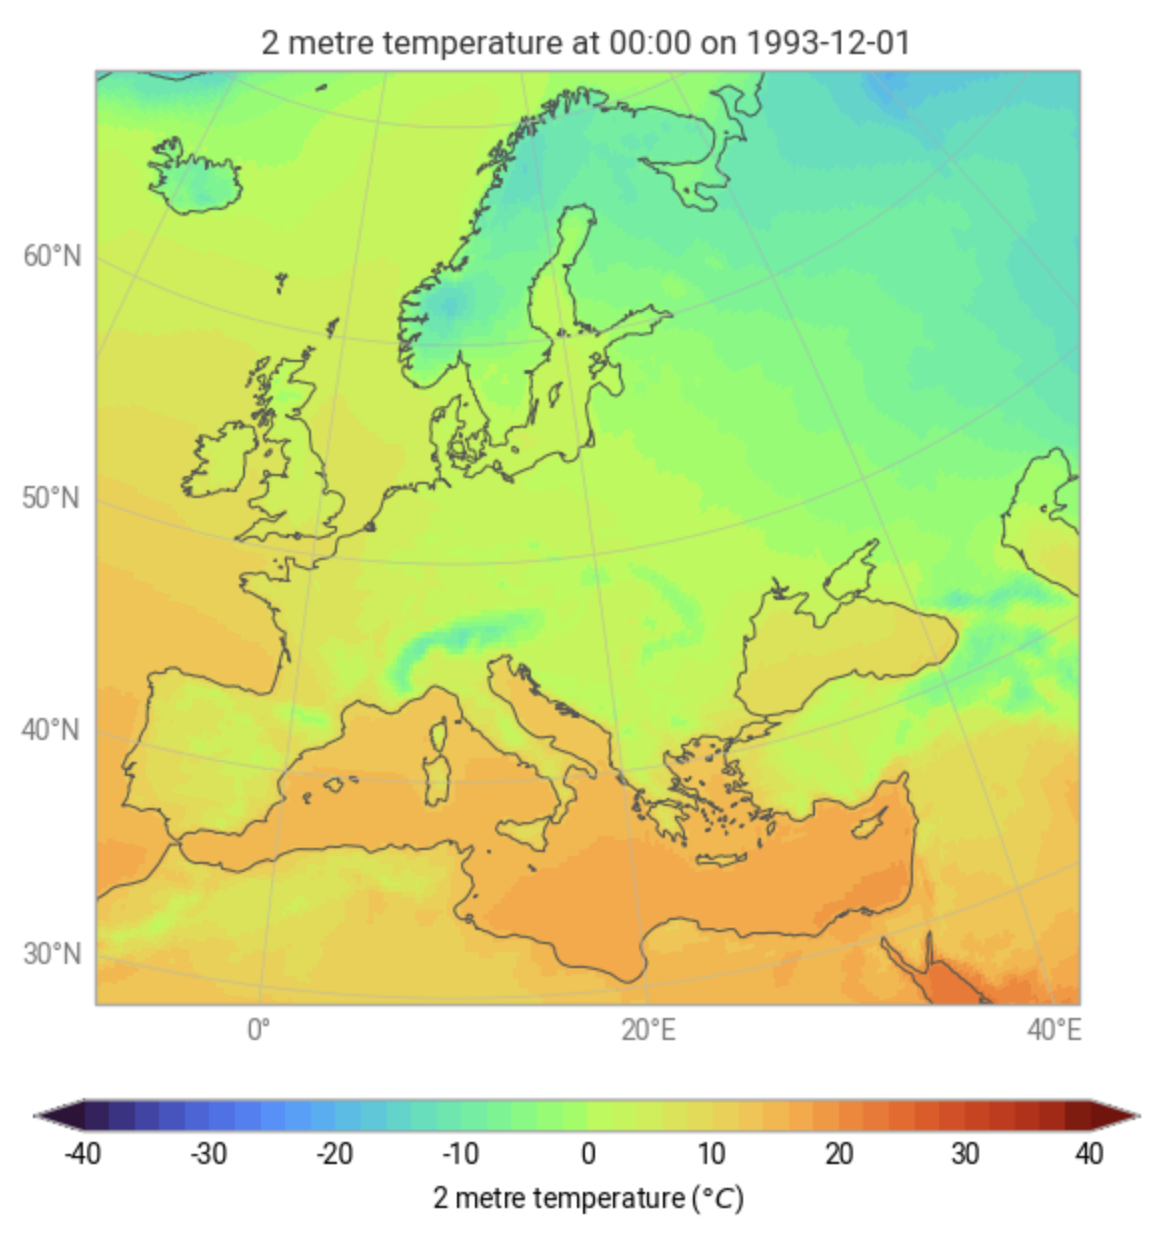
qmap.plot(data, domain="Europe", units="celsius")
earthkit-plots also provides deep levels of customisation to tailor visualisations to suit your needs.
Documentation
Examples
Installation